What a testbench is
This page answers: what am I writing when I write a testbench? It isn’t the design, and it isn’t quite a program either.
A testbench is a second circuit, and its job is to doubt the first one. We mean “circuit” literally. The design under test, the DUT, has inputs and outputs, and something has to sit on the other end of those wires to drive the inputs, watch the outputs and have an opinion about what it sees. That something is a circuit too, even though you never manufacture it.
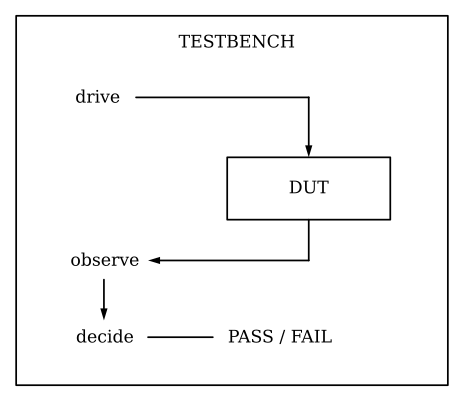
Every testbench does three jobs: drive, observe and decide. A testbench that misses a bug has failed at one of them, so it helps to keep them separate:
| Job | The question | How it fails |
|---|---|---|
| Drive | Did I put the design in the situation where the bug lives? | The bug is never provoked |
| Observe | Am I looking at the signal that would show it? | The bug happens off-screen |
| Decide | Do I have a right answer to compare against? | The bug happens in full view and nothing objects |
The shipped SimProc test from the previous page fails at the first job, drive. It never puts the processor in a situation where any of the thirteen bugs can show up, so the observe and decide jobs have nothing to work with.
Tests that can fail
Here is the shortest possible testbench:
@cocotb.test()
async def it_works(dut):
    pass
It passes on the golden core, on the core whose SUB is backwards, on the core that writes every result into the wrong register, and on the core that never signals that an instruction finished. Because it passes on all of them, it can’t tell a good core from a broken one.
Every testbench sits somewhere between that and a complete proof, and the only way to find out where yours sits is to make it fail on purpose. Until you have seen a test go red, treat it as a guess about your own code.
That’s why the DD104 verdict has two sides, one for the golden core and one for a broken core:
| Must be | Because otherwise | |
|---|---|---|
| On the golden core | PASS | You are testing the wrong thing, or your expectations are wrong |
| On a known-broken core | FAIL | You are not testing anything |
Neither half means anything on its own, which is why make check measures both and, as the previous page said, won’t give you a passing verdict until your testbench meets both.
Four ways to catch one bug
Here is make check running the shipped example testbench, labs/common/test_example.py, against the core whose SUB computes B - A. You’ll run it yourself in Lab 02, Part 3.
========================================================================
 CHECK   testbench: test_example      simulator: icarus
========================================================================
      ok  the golden core                    6 tests, all passed          7.8s
  caught  B01_sub_operands_swapped           6 tests, 4 FAILED            8.8s
        t03_arithmetic_on_different_values
            AssertionError: r1 is 199, expected 247.
        t04_flags_are_state
            AssertionError: after r1 = 255 the flags are N=0 Z=0, expected N=1 Z=0
        t05_a_loop_and_its_cycle_count
            TimeoutError: the program did not reach its parking loop at address 16 within 20000 clock
        t06_against_the_golden_model
            AssertionError: instruction 19, at address 19 (0x66 = SUB   r1, r2), left the machine in a
------------------------------------------------------------------------
 VERDICT: PASS
   Your testbench passes the good core, and on B01_sub_operands_swapped a check FIRED:
       t03_arithmetic_on_different_values: AssertionError: r1 is 199, expected 247.
       t04_flags_are_state: AssertionError: after r1 = 255 the flags are N=0 Z=0, expected N=1 Z=0
...
Four tests caught the same one-line bug in four different ways, and each is a different kind of observation:
| Test | What it noticed | Which job |
|---|---|---|
t03 |
A register holds 199 where 247 was expected |
Decide: a value against a known answer |
t04 |
The flags say N=0 Z=0 after an operation that should set N |
Observe: architectural state that is not a register |
t05 |
The program never reached the address it parks at | Drive: the machine took a path that does not end |
t06 |
Instruction 19 disagreed with a reference model | Decide: an independent implementation |
t05 is worth a second look, because nothing in it inspected a wrong value. It ran a loop controlled by a subtraction, the subtraction went the wrong way, and so the loop never ended and the symptom was a timeout rather than a mismatch. A timeout is a perfectly good bug report, as long as your testbench has a deadline. A testbench with no timeout just hangs forever and tells you nothing.
Reading a failure message
You will spend most of this course looking at red text, so it pays to read it well.
AssertionError: r1 is 199, expected 247.This is a good failure message, because it tells you what happened (199), what should have happened (247) and where to look (r1). The same bug caught by a worse testbench gives you this:
AssertionErrorIt’s the same bug, caught at the same instant, but the message tells you nothing about it. The difference is entirely in how the assertion was written:
assert sp.reg(1) == 247, f"r1 is {sp.reg(1)}, expected 247."Give every assertion you write in this course a message that names both numbers. When one of your tests fails six weeks from now, whether you wrote that message is what decides whether the failure costs you an hour of confusion.
The wrong number is also a clue in its own right. t03 runs three instructions on r1 = 200 and r2 = 60:
| Step | On the golden core | On B01, where SUB is backwards |
|---|---|---|
ADD r1, r2 |
200 + 60 = 260, wraps to 4 |
Same: 4 |
SUB r1, r2 |
4 - 60 = -56, wraps to 200 |
60 - 4 = 56 |
NAND r1, r2 |
~(200 & 60) = ~8 = 247 |
~(56 & 60) = ~56 = 199 |
The number you’re shown, 199, comes out two instructions after the bug. If you work backwards from it, the middle row gives the bug away: 200 + 56 = 256, so once you allow for the wrap, the two SUB results are exact negations of each other, which is what you get when a subtraction has its operands swapped, so the wrong number points straight at that bug. Reading a wrong number this way is a skill you can practise on every failure you cause.
The second circuit in cocotb
In classic Verilog the testbench is Verilog too: a module with no ports that instantiates the DUT and wiggles its inputs, so it really is a second circuit, written in the same language as the first.
cocotb moves the testbench into Python. Your Python doesn’t run inside the simulation; it runs beside it, and the two take turns. await Timer(1, unit="ns") looks like a sleep, but what it actually does is hand control back to the simulator, ask it to advance one nanosecond of simulated time, and ask to be woken when it gets there.
That’s why a cocotb result line gives simulated time and real time as separate numbers. This one is for t01_the_obvious_six, which checks six hand-picked cases and is the first test in the adder testbench of Lab 01:
** test_adder.t01_the_obvious_six       PASS           6.00           0.00       7127.11  **
                                                       └─ sim time (ns)  └─ real (s)  └─ ns/s
That is six nanoseconds of simulated time, one per case, in almost no real time. Simulated time is deterministic, so you can reason about it: when a DD104 page quotes an exact number of nanoseconds, yours will match to the digit, but your real-time seconds won’t match ours.
A cocotb test also needs a simulator underneath it. If you run a test file with python3 or with pytest, neither starts one, so both run nothing and report success; Your first cocotb test shows what they print.
The shortest complete DD104 test
This is a complete test file. It comes from the comment at the top of labs/common/simproc.py, the SimProc test harness that every lab imports. The harness also ships six worked tests in labs/common/test_example.py, and copying that file is how you are meant to start every SimProc lab.
import cocotb
from simproc import SimProc
from simproc_asm import ORI, ADD

@cocotb.test()
async def r1_gets_five(dut):
    sp = SimProc(dut)
    await sp.start()                              # clock, reset, blank memory
    cycles = await sp.run([ORI(5), ADD(1, 0)])    # r0 = 5 ; r1 = r1 + r0
    assert sp.reg(1) == 5, f"r1 is {sp.reg(1)}, expected 5"
    assert cycles == 9, f"took {cycles} cycles, expected 5 + 4"
All three jobs are in it: sp.run drives, sp.reg and the returned cycle count observe, and the two assertions, each with a message, decide. The count is nine because ORI takes five cycles and ADD takes four. Most people skip checking the cycle count, but it matters, because two of the thirteen bugs leave every register, flag and byte of memory correct and disturb only timing and handshake pins, so a testbench that only compares values can’t see them.
The full harness reference is The SimProc harness.
Check yourself
- Before trusting a green test, what should you do to it?
- A test reports
r1 is 199, expected 247on a core you suspect has a swappedSUB. Using the table above, which instruction’s result would you check first, and what sum would confirm the swap?
Next: Your first cocotb test.