Lab 03: Make it yours
You’ll replace the template’s adder with an 8-bit counter that the course supplies. That means changing the five places that name a design, and getting all five to agree. Then you’ll write a cocotb test that catches a one-line bug in the counter, run it with the test job’s own tools in the workbench, and push the bug and its fix so the runner shows you the same failure and the same recovery. Last, you’ll find where the gds job’s routing numbers come from, in the files that the job uploads.
Package: labs/lab-03-make-it-yours/
Before you start
Read RTL and gate-level tests and Your tools and the runner’s tools.
Finish Lab 02, so your repository is green again.
Every command runs in a terminal on the workbench desktop. In each new terminal, run these first:
. /foss/designs/common/.designinit
L=/foss/designs/modules/ic102-d/labs/lab-03-make-it-yours
TT=/foss/designs/modules/ic102-d/labs/common/tt-tools
cd /foss/designs/projects/ttsky-ic102-d
The counter is in $L/counter.v, and the comment at its top says what each pin does. You don’t need to write Verilog in this lab, but read the file once; it’s 50 lines.
This lab takes about 1 hour 30 minutes, including three gds runs of about 5 minutes each, plus 20 minutes for the optional part.
Part 1: Put the counter in
Which files name your design, and what happens when one of them disagrees?
Copy the counter in place of the adder:
cp $L/counter.v src/counter.v
git rm -q src/project.v
cp $L/test_counter.py test/test.py
Make the five names agree. Tiny Tapeout wants a top module that starts with
tt_um_and includes your GitHub username, so picktt_um_<username>_counter, with any-in your username changed to_(Verilog names can’t contain-). Then:- in
src/counter.v, renamemodule tt_um_ic102_counterto your name; - in
info.yaml, settop_moduleto it, and changesource_filesto listcounter.vinstead ofproject.v; - in
test/Makefile, setPROJECT_SOURCES = counter.v; - in
test/tb.v, put your module name on the line that names the module (Lab 02’s breakage 3 was this line).
- in
Describe the counter. In
info.yaml, change the title and description, setclock_hz: 10000000(the test runs a 10 MHz clock), and fill in the pinout from the comment incounter.v:ui[0]isEN,ui[1]isLOAD,ui[2]isDOWN,uo[0]touo[7]are the count, anduio[0]touio[7]are the load value. Rewrite both sections ofdocs/info.mdfor the counter.Check that the names agree:
python3 $L/check.py --offlineYou should see all five in agreement. Ours read:
Names
  top_module in info.yaml    tt_um_student_counter
  source_files in info.yaml  counter.v
  PROJECT_SOURCES            counter.v
  module tb.v instantiates   tt_um_student_counter
  clock_hz                   10000000
followed by a History section with no bug commit yet, a
todo:line about it, andVERDICT: not yet. That’s expected at this stage, because you make those commits in Part 3. If a name disagrees, the check says which one, in anothertodo:line.Run the test the way the test job runs it:
make -C "$TT" test PROJECT="$PWD"You should see
Running on Icarus Verilog version 12.0 (stable)andInitialized cocotb v2.1.0near the top, the same two lines the runner prints, and:** test.test_reset PASS 450.00 0.00 441401.93 ** ** test.test_count_up PASS 1450.00 0.00 2599614.96 ** ** TESTS=2 PASS=2 FAIL=0 SKIP=0 1900.00 0.00 916311.41 **The
SIM TIMEcolumn is time inside the simulation, so your numbers in it should match ours exactly. The other two columns depend on how fast your computer is.Commit and push, then predict which jobs will pass before you open the Actions tab:
git add -A git commit -m "Replace the adder with an 8-bit counter" git pushTipAnswerAll six, if the names agree.
gdsbuilds a new layout fromcounter.v,gl_testruns the two tests on that layout’s netlist, anddocschecks the newinfo.yaml. The test reads only the pins and samples them on the falling clock edge, so it doesn’t depend on any name inside the design, which the netlist doesn’t keep.
You should see: two passing tests locally, and six green jobs on GitHub.
Part 2: A test that catches the bug
What does a test need to catch a one-line bug?
Put the course’s bug into your counter, without committing it, and look at it:
python3 $L/bug.py apply
git diff src/counter.v
You should see:
src/counter.v: the load line now reads `count <= ui_in;` (not committed; see it with git diff)and a diff of one line:
- count <= uio_in; + count <= ui_in;LOADnow loads the counter from the control pins instead of the load-value pins. That’s a believable slip, since the two names differ by one letter.Before you run the test, predict whether the two starter tests catch it. Then run them:
make -C "$TT" test PROJECT="$PWD"You should see
TESTS=2 PASS=2 FAIL=0, the same as before the bug. Neither test ever raisesLOAD, so neither can tell which bus it loads from.Write a third test,
test_load, at the end oftest/test.py, where the comment# Part 2: add a test of LOAD here.is. Use the two starter tests as a model: callstart, put a value onuio_in, raiseLOADwithdut.ui_in.value = LOAD, let one rising edge go by withawait cycles(dut, 1), and assert thatuo_outholds the value, with a message that says what you expected and what you got. Pick a value that the bug can’t load by accident: withLOADhigh,ui_inis0b00000010, so the buggy counter always loads 2.If an AI tool helps you write it, that’s fine; you’ll still have to show in step 4 that it fails on the bug, and that’s what tells you the test works.
Run the tests with the bug still in:
make -C "$TT" test PROJECT="$PWD"You should see your test fail with your own message. Ours read:
AssertionError: after LOAD with uio_in = 0x5A, uo_out is 00000010, expected 0x5A
** test.test_load                 FAIL         550.00           0.00    1319923.08  **
** TESTS=3 PASS=2 FAIL=1 SKIP=0               2450.00           0.00     658192.91  **
then two lines from
make:make[1]: *** [/foss/designs/modules/ic102-d/labs/common/tt-tools/.local/venv/lib/python3.11/site-packages/cocotb_tools/makefiles/simulators/Makefile.icarus:69: results.xml] Error 1 make: *** [Makefile:42: test] Error 2The first is cocotb’s own
makestopping, because with cocotb 2.x it checksresults.xmlas the last step of every run and fails when a test failed. The second is the course’smakepassing that on. (The template’s workflow comment saysmake“will return success even if the tests fail”; that was true of cocotb 1.x.) You’ll need this in Lab 05, where a script has to tell a failing test from a design that doesn’t compile.TipAnswer: one test that works@cocotb.test() async def test_load(dut): await start(dut) dut.uio_in.value = 0x5A dut.ui_in.value = LOAD await cycles(dut, 1) assert dut.uo_out.value == 0x5A, f"after LOAD with uio_in = 0x5A, uo_out is {dut.uo_out.value}, expected 0x5A"Take the bug out and run the tests again:
python3 $L/bug.py undo
make -C "$TT" test PROJECT="$PWD"
You should see
test.test_load PASS 550.00(with your test’s simulated time, if it differs) andTESTS=3 PASS=3 FAIL=0.Commit your test and push it:
git add test/test.py
git commit -m "test: LOAD loads uio_in"
git push
You should see: your test failing on the bug and passing without it, locally.
Part 3: The bug on the runner
Does the runner’s test job see what your workbench saw?
Wait for the push from Part 2 to go green. Then commit the bug, as a teammate might, and push:
python3 $L/bug.py commit
git push
You should see
Committed the bug as <hash>: counter: tidy up the load path.Before you look, predict which jobs fail. Then open the
testrun, find your assertion in the “Run tests” step, and compare it with step 4 of Part 2: the message, theFAILline and its simulated time.TipAnswertestfails, and so doesgl_testin thegdsworkflow, which runs the same three tests on the gate-level netlist.docs,gds,precheckandviewerpass, because the design still builds; it just does the wrong thing. The runner’s message andSIM TIMEmatch yours exactly, because the runner used the same cocotb 2.1.0 and Icarus 12.0. In the course’s practice repository (run 43841055248) “Run tests” printedInitialized cocotb v2.1.0 from /opt/hostedtoolcache/Python/3.11.18/...,Running on Icarus Verilog version 12.0 (stable), and:AssertionError: after LOAD with uio_in = 0x5A, uo_out is 00000010, expected 0x5A ** test.test_load FAIL 550.00 0.00 1698301.39 ** ** TESTS=3 PASS=2 FAIL=1 SKIP=0 2450.00 0.00 1017018.65 **gl_testprinted the same three lines, withRunning on Icarus Verilog version 13.0 (stable)and its own numbers in the last two columns.Undo the bug with a new commit, and push:
git revert --no-edit HEAD
git push
When every job is green, run the check:
python3 $L/check.pyIt finds the bug commit and the fix after it, and asks GitHub for the jobs on each. On the course’s practice repository it printed:
Checking /foss/designs/projects/ttsky-ic102-d

Names
  top_module in info.yaml    tt_um_vprohacks_counter
  source_files in info.yaml  counter.v
  PROJECT_SOURCES            counter.v
  module tb.v instantiates   tt_um_vprohacks_counter
  clock_hz                   10000000

History
  bug commit  cd57aae
  fix commit  8f29d8f

GitHub: vproHacks/ic102-test-d
  test on the bug commit cd57aae: failure
  every job on the fix commit 8f29d8f:
    docs      success
    test      success
    gds       success
    precheck  success
    gl_test   success
    viewer    success

VERDICT: PASS
You should see: test red on the bug commit and green on the revert, with the same message you saw locally.
Part 4: The numbers in the gds job
Where do the numbers on the run’s summary page come from?
Open the latest
gdsrun on GitHub (signed in) and scroll down its summary page to thegdsjob’s summary. Under “Routing stats” there’s a table with two numbers, “Utilisation (%)” and “Wire length (um)”. Write both down.
The routing stats in the gds job’s summary, from the course’s practice counter. Further down the same page, under Artifacts, download
GDS_logswith the download button at the end of its row. You have to be signed in to see the button. Unzip it into your workspace folder on your laptop, so the workbench sees it under/foss/designs: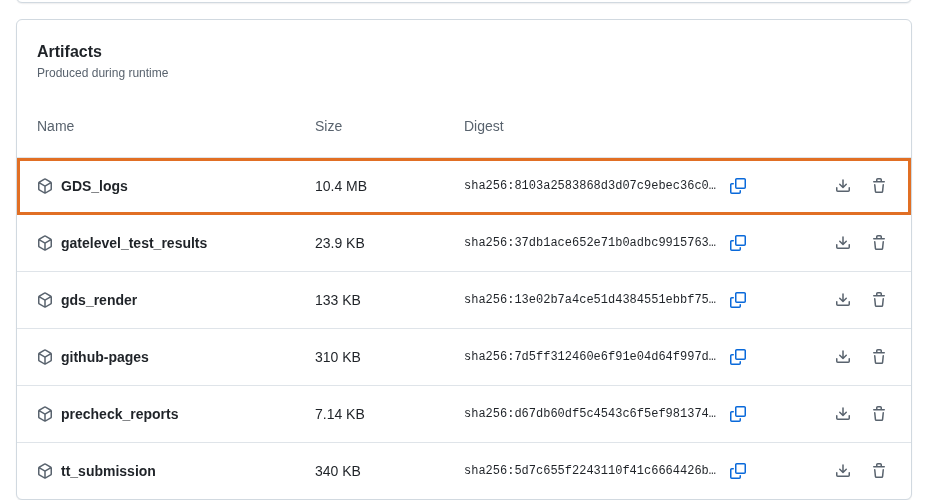
The Artifacts section of a gds run’s summary page, with GDS_logs highlighted. The artifact holds
src/, with the configuration the action built, andruns/wokwi/, LibreLane’s whole run: one numbered folder per step, about 70 of them, and afinal/folder.Find each number’s source. The utilisation is a line in the global-placement step’s log, and the wire length is a row in
final/metrics.csv. If you unzipped the artifact into a folder calledGDS_logsat the top of your workspace:cd /foss/designs/GDS_logs grep GPL-0019 runs/wokwi/*-openroad-globalplacement/openroad-globalplacement.log grep '^route__wirelength,' runs/wokwi/final/metrics.csvIn the course’s practice repository, whose counter’s summary is the one in the picture above (run 43839710228), they read:
[INFO GPL-0019] Utilization:                     5.293 %
route__wirelength,1807
In
sentry‘s green run 43796948508, a 2x2 design at the time, they were0.628 %and919. Yours should match the two numbers you wrote down in step 1, because the action’s “Routing summary” step reads its numbers from these same two places (print_statsin tt-support-tools’project.py).While you’re in the run folder, read
runs/wokwi/*-misc-reportmanufacturability/manufacturability.rpt(step 72, insentry’s run and in the practice counter’s). It saysPassedunder Antenna, LVS and DRC: thegdsjob checks its own layout beforeprecheckchecks it again.Add a short “Numbers” section to your
README.mdwith the two values, the run they came from, and the two file paths. Commit and push it.
You should see: the summary’s two numbers and the two lines in the artifact agree.
Part 5: A counter with no reset (optional)
About 20 minutes. Tiny Tapeout’s documentation says that on an ASIC “flops will have a random initial value at power on”, so “Initial statements are not allowed, so you must use an explicit reset.” Find out what happens if you ignore that.
On a new branch, remove the reset from
counter.v: delete theif (!rst_n) count <= 8'd0; elsepart of thealwaysblock, and addinitial count = 8'd0;afterreg [7:0] count;. Addrst_nto the_unusedlist.Predict whether the RTL test still passes, then run
make -C "$TT" test PROJECT="$PWD".TipAnswerYes, all three. In simulation an
initialstatement sets the register at time 0, so the count starts at 0 whether or not reset does anything. We gotTESTS=3 PASS=3 FAIL=0.Predict which tests fail at gate level, then push the branch and wait for
gl_test.TipAnswertest_resetandtest_count_up. Synthesis can’t build aninitialstatement into a flip-flop, so in the netlist the count starts unknown, and counting up from unknown stays unknown.test_loadpasses, because loading sets every bit. In the course’s practice repository (run 43843559172),gl_testran the three tests on the runner’s netlist with Icarus 13.0 and printed:AssertionError: after reset uo_out is XXXXXXXX, expected 0 AssertionError: after 10 cycles with EN high uo_out is XXXXXXXX, expected 10 ** test.test_reset FAIL 450.00 0.01 32495.41 ** ** test.test_count_up FAIL 1450.00 0.00 2716307.02 ** ** test.test_load PASS 550.00 0.00 1897683.79 ** ** TESTS=3 PASS=1 FAIL=2 SKIP=0 2450.00 0.02 154991.26 **ttsky-verilog-tinyCGRA’s history from May 2026 shows the same pattern: its gate-level test failed, and commits titled “comment all user_project asserts” followed.Delete the branch, on GitHub and locally;
mainkeeps its reset. The branch’sviewerjob passed, and it published the branch’s layout to your project’s page, which shows the no-reset counter until the nextgdsrun onmain.
Finishing
You’re done when python3 $L/check.py prints VERDICT: PASS: the five names agree, the runner’s test job failed on the bug commit, and all six jobs passed on the commit that took the bug out.
Questions:
The starter tests passed on the buggy counter. What would you have needed to know to write
test_loadwithout being shown the bug?TipAnswerOnly the specification in the comment at the top of
counter.v:LOADloads the value onuio_in. A test of every behaviour in the specification would have included it, and would have caught the bug the moment it was committed. Writing tests from the specification, rather than from the bugs you know about, is what DD104 is about.Your test passed with Icarus 12.0 in the workbench. Is that enough to be sure the runner’s
testjob passes?TipAnswerFor this test, yes: the runner’s job uses the same Icarus 12.0 and cocotb 2.1.0, and
make testruns the job’s steps. Two things could still differ: yourtest/requirements.txt(both jobs install from it, andmake testwarns when it differs from the course’s), and anything outside the test, which is why thegdsjobs exist. Your tools and the runner’s tools goes through the gaps.
Submit: the link to your repository.
Going further (optional)
Run the same test with the other two Icarus versions:
make -C "$TT" test-icarus13 PROJECT="$PWD"
make -C "$TT" test-workbench PROJECT="$PWD"
With our counter and the two starter tests, all three versions gave the same results and simulated times (test.test_reset PASS 450.00, test.test_count_up PASS 1450.00). Your tools and the runner’s tools shows a design where they don’t agree.
Next on the Course path: read Pull requests and review, Branch rules and How open-source projects work, then do Lab 04: A change through review.