Filters are tone knobs
The bass and treble knobs on a car stereo don’t add any new notes to the music; they turn some frequencies up and others down. A filter does the same thing to a signal. It takes the signal’s recipe of sines and turns each entry up or down, and it also delays each one a little. The report card for a filter is its Bode plot, which is the most-used graph in analog design.
A circuit as a frequency machine
A Bode plot shows two things, both plotted against frequency:
- Magnitude: how much of the signal comes out, \(\lvert H(f)\rvert\), usually in dB
- Phase: how late it arrives, \(\angle H(f)\), in degrees
The RC low-pass
A resistor \(R\) and a capacitor \(C\) in the classic low-pass arrangement let slow signals through and turn fast ones down, so together they act like a treble-cut knob. It’s the first filter everyone builds, and its cutoff frequency is
\[ f_c = \frac{1}{2\pi R C} \]
You don’t need calculus here, because the course doesn’t derive its magnitude and phase; take the two formulas below as given for now. They describe what you would measure if you swept the filter through frequencies one at a time:
\[ \lvert H(f)\rvert = \frac{1}{\sqrt{1 + (f/f_c)^2}} \qquad \angle H(f) = -\arctan(f/f_c) \]
At \(f = f_c\) the magnitude is \(\lvert H\rvert = 1/\sqrt{2}\) (−3 dB) and the phase is −45°. With \(R = 1\,\mathrm{k}\Omega\) and \(C = 100\,\mathrm{nF}\), for example, \(f_c \approx 1592\) Hz.
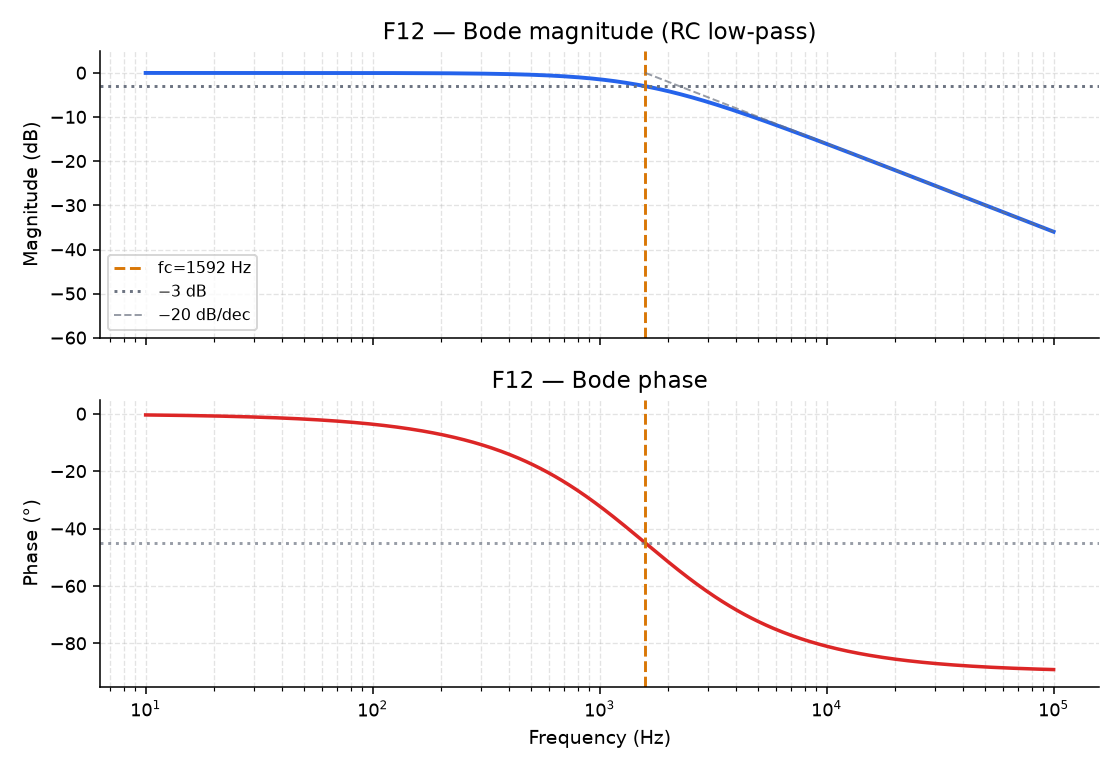
Only the product \(RC\) matters, so if you double \(R\) and halve \(C\), \(f_c\) stays where it is, like two different amp settings that happen to land on the same tone.
In Lab 04, Part 1, you’ll move R and C on the F12 explorer, and then draw this Bode plot from the two formulas in a script of your own.
Next: Reading a Bode plot