What a framework buys you
This page answers: what is UVM for, and what does it cost on the simulator this course uses?
A testbench framework is a library of base classes plus a set of rules for how the pieces you build from them fit together and when each one runs. UVM, the Universal Verification Methodology, is the one this course uses. In Lab 01 you’ll test SimProc’s ALU twice, once with the cocotb test from DD104 Lab 03 and once with a UVM testbench. You’ll measure what each costs in lines, build time and run time, and see what each reports on three planted bugs. This page goes through what we measured when we ran the lab, so you know what you’re looking at when your own numbers come in. Your times will differ a little from ours, but the counts (lines, vectors and errors) should match.
What UVM is
UVM is a library of SystemVerilog classes, standardised as IEEE 1800.2. It isn’t part of the simulator, and the course image doesn’t include a UVM library, so the course carries its own copy in third_party/uvm. That copy is UVM 2020-3.2 from chipsalliance/uvm-verilator at commit 5d72b66, which compiles on the course’s Verilator 5.050. Every lab’s build compiles it along with your testbench.
The library gives you a base class for each job a testbench does, and the machinery that connects them. Lab 01’s testbench uses these parts of it:
- base classes for the pieces:
uvm_sequence_itemfor one transaction,uvm_sequencefor a stream of them, anduvm_driver,uvm_monitor,uvm_scoreboard,uvm_agent,uvm_envanduvm_testfor the components; - phases, which build every component, connect them, run them, and then call each one’s check and report functions, in that order, and objections, which the test raises and drops to tell UVM when the run phase is over;
uvm_config_db, which carries the virtual interfaces from the top module to the driver, the monitor and the test;- analysis ports, which pass each transaction the monitor writes to every component connected to the port, here the scoreboard;
- a report server, which counts every
`uvm_errorby its ID and prints the counts at the end; +UVM_TESTNAME, which picks the test when the simulator starts.
Lab 01’s testbench also makes every component, sequence and transaction through UVM’s factory, with type_id::create. Lab 04 adds a factory override, which lets a test swap one class for another without editing the code that makes it.
The two testbenches
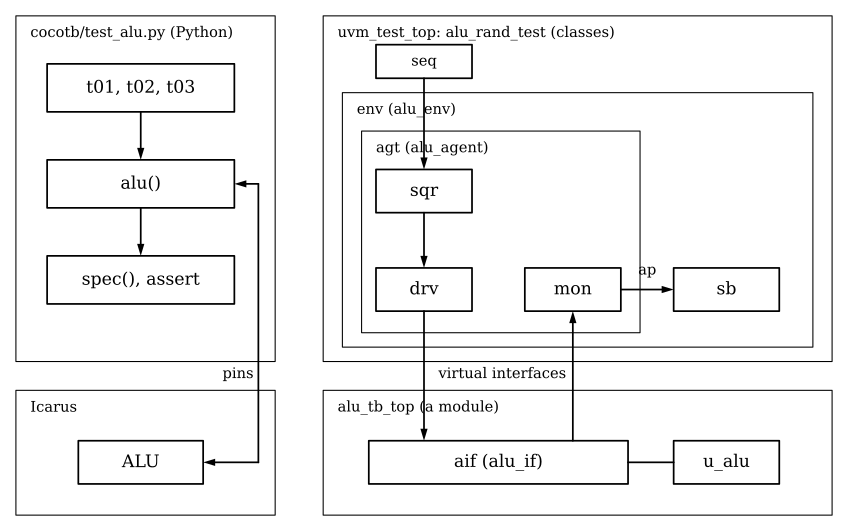
Lab 01’s two testbenches. On the left the Python test runs beside Icarus and reaches into the ALU through its pins. On the right everything is compiled into one simulator: the classes on top, the module with the interface and the ALU below.
Both testbenches do the same three things: make vectors, put them on the ALU’s pins, and compare what comes back with a model. The cocotb test does all three in one file of plain functions: alu() drives the pins and reads them back, spec() is the model, and each test function loops over its vectors and asserts.
The UVM testbench gives each job its own class. A sequence makes alu_item objects and hands them to the sequencer, which passes them to the driver. The driver puts each one on the pins through the interface’s clocking block, one per clock cycle, and sets the interface’s valid signal in each cycle that carries a vector. In every cycle with valid high, the monitor reads the pins back into an alu_item, the ALU’s answer included, and writes it to its analysis port. It doesn’t know what the answer should be. The scoreboard receives each item, works out the right answer with predict(), and compares it with what the monitor saw. The agent and the environment create the pieces and connect them, and at the end of the run the environment also checks that the scoreboard checked every vector the driver sent. The test picks which sequence to start. Lab 01, Part 3 has a table that matches each class with the part of test_alu.py that does the same job.
What it costs
These are the costs Lab 01 measured, in the course image on 2 CPUs:
| cocotb, on Icarus | UVM, on Verilator | |
|---|---|---|
| Lines of code (not counting blank lines and comments) | 94 | 282 |
| First build | 0.6 s | 102 s |
| Rebuild after you change the testbench | none | 26 s to 99 s |
| Run | 23.8 s, 17.5 s of it in t02’s 393,216 vectors |
1.17 s for 2000 vectors |
| Time per vector | about 0.04 ms | about 0.6 ms |
Lines. The UVM testbench has three times as many code lines, and most of the extra lines are in pieces the cocotb test doesn’t need: an agent and an environment that create the other pieces and connect them, a constructor and a registration macro in every class, and a driver and a monitor that between them do what four lines of alu() do (its three .value = lines and its return).
Build. Verilator turns the testbench, the ALU and the whole UVM library into C++, and g++ compiles it. Lab 01’s build report says the sources came to 24 MB in 386 modules, and that g++ spent 98.5 s of the 102. The ALU’s file is 94 lines of those 24 MB. The lab’s optional last part runs the cocotb test on Verilator instead of Icarus. There Verilator compiles only the ALU, and the build took 13.3 s, so most of the 102 s goes to the UVM library rather than to the design.
Rebuilds. A change to a Python test costs nothing before the next run. A change to a SystemVerilog class costs a rebuild, and how long it takes depends on what you changed. The course keeps a compiler cache (ccache) in your clone, so a rebuild can reuse whatever didn’t change. Changing repeat (3) to repeat (4) in alu_base_test’s run_phase rebuilt in 26 s, with 35 of 36 compiled files taken from the cache. Adding one member to the scoreboard class rebuilt in 93 s, with only 10 of 36 taken from the cache, because a new member changes the class’s layout and most of the C++ that Verilator generates changes with it. So when you can, put a change inside a function or task body rather than adding a member, or make it through a plusarg such as +N=500, which needs no rebuild at all.
Speed. Per vector, the UVM testbench is more than ten times slower than the cocotb test, about 0.6 ms against 0.04 ms. The run is still quick, 1.17 s, because the test sends 2000 random vectors rather than sweeping all 393,216 as DD104’s t02 does.
Running UVM on Verilator 5.050 has two more costs. A UVM run that reports errors still exits with status 0, and a constrained randomize() with no solver available fails without stopping the run. The course handles both for you. Every lab’s makefile includes labs/common/uvm.mk, which sets up the solver, and every test extends dd105_base_test, which checks the solver at the start of the run and turns any UVM_ERROR into a nonzero exit status at the end.
What it buys
For that cost, Lab 01’s UVM testbench gives you three things, all of them modest on a design as small as one ALU.
- Checking kept apart from stimulus. In Lab 01, Part 5 you add a check of the
NandZflags to the scoreboard. Bothalu_rand_testandalu_directed_testuse it without being edited, because neither test does any checking of its own. Intest_alu.py,t01,t02andt03each do their own comparison, so a new check would have to be written into each of them. - Tests picked at run time.
alu_directed_testis one short sequence and one short test class that reuse the driver, the monitor and the scoreboard. It’s built into the same simulator asalu_rand_test, and+UVM_TESTNAMEpicks one of them when the simulator starts, so switching to it needs no rebuild. The whole command took 0.17 s. Every lab in the course builds once and picks tests, seeds and planted bugs this way. - Error counts by ID. With bug A01 on, the shipped scoreboard reported 282 errors, and UVM’s report server printed
[VALUE] 282in its counts by ID. If you give the flag check its own ID, the summary keeps separate counts of value mismatches and flag mismatches, which DD104 Lab 03’st02has to do by hand.
Deciding what to check is still up to you. Against Lab 01’s three bugs, the shipped UVM scoreboard caught A01 with 282 errors and A02 with 255, and missed A03 with no errors at all. The cocotb test caught all three, because its t02 compares the flags and the shipped scoreboard doesn’t. Once you add the flag check, the UVM test catches A03 with 131 errors in 2000 vectors.
You get more back on a bigger design, and the router you’ll test from Lab 02 on is the kind of design UVM was made for. The router has a register bus, an input stream and two output streams, so a testbench for it has a driver and a monitor for each of those interfaces, and a scoreboard that predicts which output each packet comes out of. Labs 02 and 03 build that testbench from plain SystemVerilog classes first, so that each UVM piece has an obvious job when it appears. Lab 04 then moves it into UVM and counts what moved and what was added.
Check yourself
In Lab 01’s scoreboard you change the body of
predict(). About how long will the rebuild take? And if you add anint unsignedcounter to the scoreboard class instead?TipAnswerAbout 26 s, because after a change inside a function body the ccache can still supply almost every compiled file. A new member costs close to a full build, about 93 s in our run, because it changes the class’s layout and most of the generated C++ changes with it.
Without
dd105_base_test, what exit status would Lab 01’s UVM run have with 282 errors in its log, and why does that matter?TipAnswer- On Verilator 5.050 a UVM run ends with exit status 0 however many errors it reported, so anything that judges the run by its exit status, such as
makeor a regression script, would count it as a pass.dd105_base_testcalls$fatalat the end of the test if UVM counted any error, and that makes the exit status nonzero.
- On Verilator 5.050 a UVM run ends with exit status 0 however many errors it reported, so anything that judges the run by its exit status, such as
The shipped UVM testbench misses A03 and the cocotb test catches it. Does that tell you anything about UVM?
TipAnswerNo. The cocotb test compares the flags and the shipped scoreboard compares only the value, so the two testbenches check different things. With the flag check added, the UVM testbench catches A03 too.
Further reading
ChipVerify’s UVM section explains the library one class at a time. Its examples are written for commercial simulators, not for Verilator with the 1800.2 library this course uses, and the course doesn’t reuse its code.
- UVM Tutorial: a map of the library’s main pieces and the SystemVerilog it assumes you know.
- UVM Introduction: why UVM exists, and the difference between components and objects. Correction: its monitor fragment never constructs its analysis port, so as written its
ap.write()would use a null handle.