Area, parasitics and delay
This page explains the experiment that Lab 03’s transistor sizes were chosen for.
Take the same two transistors, with the same width, the same length and the same device flavours, right down to the model name, and draw them twice: once the way the foundry did, packed to the last 0.005 µm, and once the way you do in Lab 03, with room to move. Because the devices are identical, any difference between the two cells has to come from the drawing. You run the comparison in Lab 05.
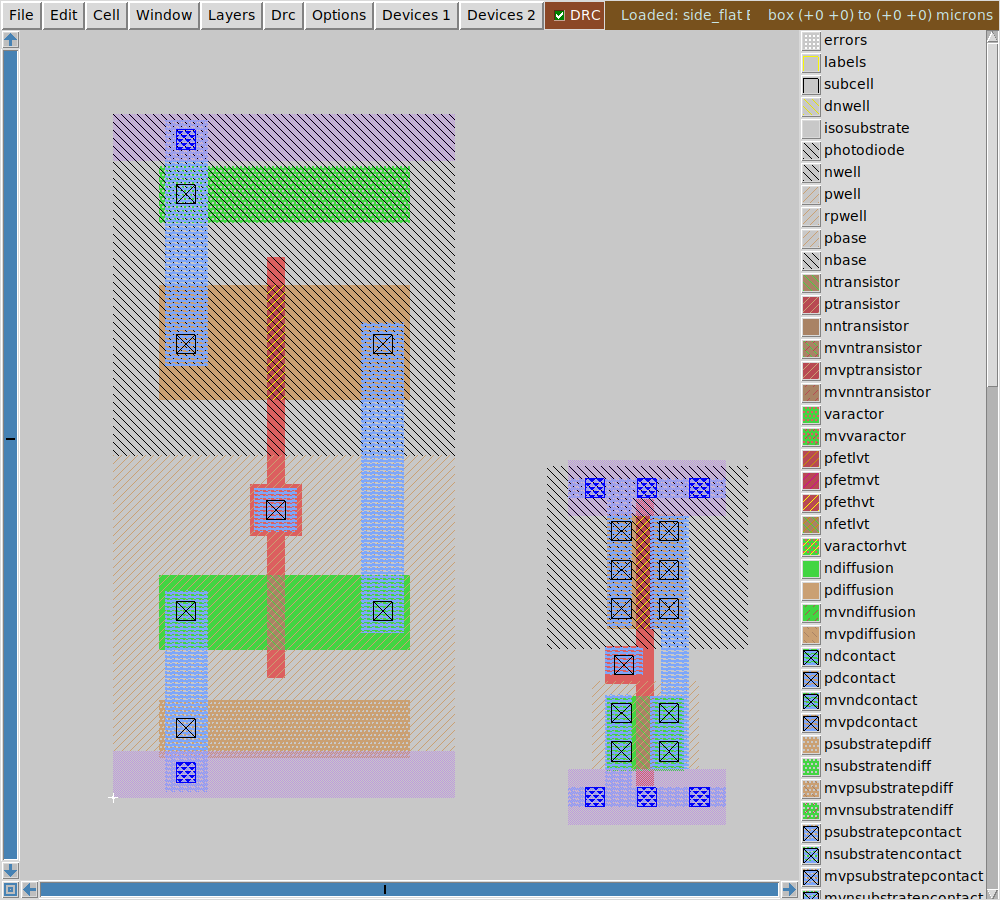
Both cells are one NMOS at W = 0.65 µm and one high-Vt PMOS at W = 1 µm, with L = 0.15 µm for both. The devices are the same, and yours takes 4.8 times the area.
The numbers
Lab 05 runs the extraction and both simulations and prints this table:
| yours | the foundry’s | ratio | |
|---|---|---|---|
| cell width | 3.00 µm | 1.38 µm | 2.17 × |
| cell height | 6.00 µm | 2.72 µm | 2.21 × |
| cell area | 18.00 µm² | 3.7536 µm² | 4.80 × |
| NMOS W / L | 0.65 / 0.15 | 0.65 / 0.15 | 1.00 × |
| PMOS W / L | 1 / 0.15 | 1 / 0.15 | 1.00 × |
| NMOS drain junction area | 0.715 µm² | 0.169 µm² | 4.23 × |
| PMOS drain junction area | 1.1 µm² | 0.26 µm² | 4.23 × |
| extracted capacitance, total | 1.86 fF | 1.424 fF | 1.31 × |
| FO4 delay, average | 62.88 ps | 57.73 ps | 1.09 × |
| ring-oscillator stage delay | 42.58 ps | 32.80 ps | 1.30 × |
Look at the two delay rows. Your cell is 9 % slower than the foundry’s in one test and 30 % slower in the other, and most of this page is about why the two tests disagree by that much.
FO4 delay and ring-oscillator delay
A gate’s delay is, roughly, how long its transistors take to charge whatever is attached to the output. That load has two parts:
- the load you are driving: the gate capacitance of the cells downstream
- the load you brought with you: your own drain junctions and your own wiring, which have to be charged whether anything is connected or not
Your layout controls only the second part, and for a given layout it stays close to a fixed number of femtofarads.
In a fan-out of 4 (FO4) test, the output drives four copies of the same cell. The gate capacitance of those four copies dominates the load, and it’s the same for both cells because their W and L are the same. Your extra junction area is then only a small share of the total, so you come out 9 % behind.
A ring oscillator is a loop in which each stage drives exactly one copy of itself and nothing else. With only one gate downstream, the self-load is a much bigger fraction of the total, so your 4.23 × junction area shows up in full and you come out 30 % behind.
Layout parasitics act roughly like a fixed extra load, so they’re lost in the noise when a gate drives something big, and they dominate when it drives something small.
Most gates in a real chip drive something small, which is why the foundry packs its cells to the last nanometre even though “it is only a few femtofarads”.
Where the femtofarads come from
Here is part of what ext2spice cthresh 0 pulls out of each cell:
yours, all of it              the foundry's, only the lines on Y
C0 Y A       0.02272f         C1 Y VPWR    0.07413f
C1 VPWR A    0.10808f         C5 Y VPB     0.01774f
C2 Y VPWR    0.06413f         C6 VGND Y    0.05975f
C3 Y VGND    0.33997f         C7 Y A       0.03773f
C4 VPWR VGND 1.32518f         C11 Y VNB    0.1626f
                              ... 14 lines in total
(Magic doesn’t always write the C lines in the same order, so yours may be numbered differently, but the values don’t change from run to run.)
Your total is higher, 1.86 fF against 1.424 fF, and so is the part that Lab 05 prints as “of it on the output”: 0.4268 fF for yours against 0.3519 fF for theirs. Neither ratio, 1.31 × and 1.21 ×, comes anywhere near the 4.23 × of the drain junction areas.
That’s because the extracted capacitors don’t include the drain junctions. They are the capacitance of the wiring and the well: between one wire and another, from the wires down to the substrate and the well (the lines ending in VNB and VPB in the foundry’s list), and between the well and the substrate. The junction capacitance of the source and drain diffusions lives inside the device model instead, which computes it from the ad, as, pd and ps parameters, and your values for those are 4.23 × theirs.
Adding it up:
- The extracted capacitance is against you, but only by 1.2 to 1.3 times.
- Junction capacitance is strongly against you, by a factor of four.
- Junction capacitance is also the bigger of the two numbers.
You can’t read this off the parasitic netlist, because the junction capacitance isn’t in it. You have to simulate both cells to see the total, which is why Lab 05 runs the simulations.
Area
18 µm² against 3.75 µm² can sound like an academic difference, but it stops being one when you multiply it by the number of cells on a chip.
A modest open-source SoC has a few hundred thousand standard cells. At the foundry’s density that comes to about 1.5 mm² of logic, and at yours it’s 7 mm². Die cost goes roughly with area, and yield goes down as area goes up, so each finished chip costs several times more and you get fewer good ones per wafer. That is the whole commercial argument for a standard-cell library, and it’s the reason a library is drawn once, by someone very patient, and then instanced a million times.
Summary
Your layout is deliberately roomy so that you can draw it by hand in an afternoon, and Lab 05 puts a price on that choice. These are the points to take away:
- Identical transistors don’t give identical circuits, because everything that isn’t in the schematic is decided by the layout.
- The cost of a loose layout is small per gate and very large per chip.
- You can measure it. Measuring the gap between your cell and the foundry’s takes one
makeand about half a minute, so you don’t have to argue about it.