Reading a workflow file
This page answers: what does a workflow file tell GitHub to do, and when a run goes red, how do you find the one line that says why?
You won’t need to write a workflow from scratch in this course, because Tiny Tapeout has written them for you. You will read them, though, and read the runs they produce, because a red cross on its own tells you only that something failed. The workflow file tells you what was supposed to happen, and the run’s log tells you where it stopped. With both, most failures take a minute to explain. You’ll practise this on five broken commits in Lab 02.
What a push starts
Each YAML file in .github/workflows/ is one workflow. When you push, GitHub starts every workflow whose trigger includes a push, and each one becomes a separate run with its own entry on the Actions tab and its own tick or cross next to your commit. A run is made of jobs, and each job is a list of steps.
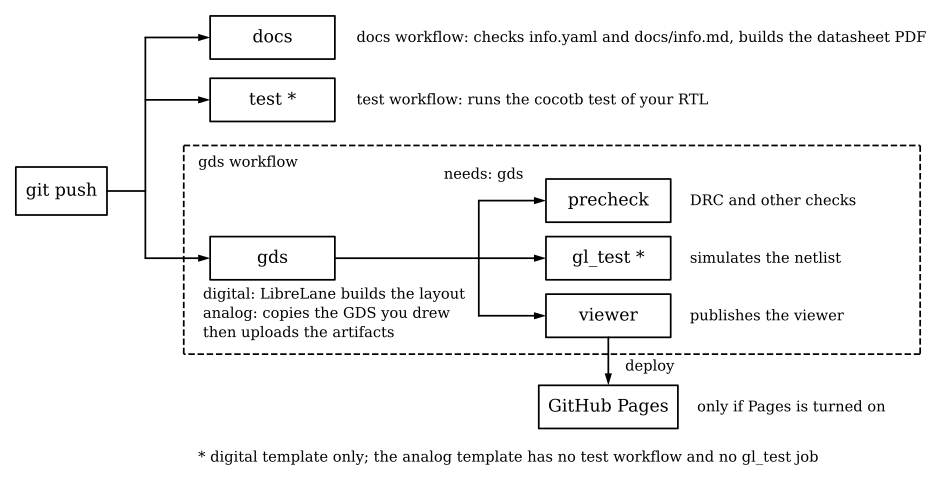
The digital template has four workflow files (docs.yaml, test.yaml, gds.yaml and fpga.yaml), but fpga is switched off, so a push starts three runs. The analog template has two, docs.yaml and gds.yaml. The page after this one in the course path goes through your template’s workflows job by job; this page is about how to read any of them.
The parts of a workflow file
Here is the digital template’s gds.yaml in full, as it was at the template’s commit a42e666 (Oct 14, 2026):
name: gds

on:
  push:
  workflow_dispatch:

jobs:
  gds:
    runs-on: ubuntu-24.04
    steps:
      - name: checkout repo
        uses: actions/checkout@v6
        with:
          submodules: recursive

      - name: Build GDS
        uses: TinyTapeout/tt-gds-action@ttsky26d
        with:
          pdk: sky130A

  precheck:
    needs: gds
    runs-on: ubuntu-24.04
    steps:
      - name: Run Tiny Tapeout Precheck
        uses: TinyTapeout/tt-gds-action/precheck@ttsky26d

  gl_test:
    needs: gds
    runs-on: ubuntu-24.04
    steps:
      - name: checkout repo
        uses: actions/checkout@v6
        with:
          submodules: recursive

      - name: GL test
        uses: TinyTapeout/tt-gds-action/gl_test@ttsky26d

  viewer:
    needs: gds
    runs-on: ubuntu-24.04
    permissions:
      pages: write      # to deploy to Pages
      id-token: write   # to verify the deployment originates from an appropriate source
    steps:
      - uses: TinyTapeout/tt-gds-action/viewer@ttsky26d
Reading it from the top:
nameis what the Actions tab and the badges call the workflow.onsays what starts it. Here that’spush, on any branch, andworkflow_dispatch, which puts a Run workflow button on the Actions tab so you can start a run by hand. None of the template’s workflows listpull_request, so opening a pull request doesn’t start anything by itself; the runs you see on a pull request come from the pushes to its branch.jobsholds four jobs, namedgds,precheck,gl_testandviewer. Each runs on its own fresh machine, chosen byruns-on: ubuntu-24.04, of the kind that What a cloud runner is describes.needs: gdsmakes a job wait untilgdshas finished, and run only if it succeeded. Jobs withoutneedsstart at once and in parallel, so the three jobs that needgdsall start together when it’s done.stepsrun in order, and a step either runs a shell command (run:, as intest.yaml) or calls an action (uses:), which is a packaged set of steps kept in another repository. The text after the@is the version of the action to use: a tag (ttsky26d), a version number (v6), or a commit hash.withpasses inputs to an action:submodules: recursivetells the checkout action to fetch submodules too, andpdk: sky130Atells Tiny Tapeout’s action which process to build for.permissionssets what the job’s automatic access token may do.viewerasks to write to Pages and to get an identity token, because GitHub requires “a minimum ofpages: writeandid-token: writepermissions” for a job that deploys a Pages site (custom workflows).
The analog template’s gds.yaml has the same shape with two differences. Its gds job reads top_module from info.yaml and passes gds/<top_module>.gds and lef/<top_module>.lef to a different action, tt-gds-action/custom_gds, which copies and converts your layout instead of building one. It also has no gl_test job.
One step in the digital test.yaml is worth reading closely, because it shows how GitHub decides whether a step passed:
      - name: Run tests
        run: |
          cd test
          make clean
          make
          # make will return success even if the tests fail, so check results.xml for failed tests
          python -m cocotb_tools.check_results results.xml
GitHub runs these lines with bash -e (the log prints shell: /usr/bin/bash -e {0} above the step), so the step stops and fails as soon as any command exits with a non-zero status, and passes if none does. That exit status is all GitHub looks at. The comment above the last line was true of cocotb 1.x, whose make exited with status 0 even when a test failed, which is why the template adds a command that reads the results file and exits non-zero if any test failed. The template now pins cocotb 2.1.0, and with cocotb 2.x make runs that same check itself at the end of the simulation, so a failing test stops the step at make, and the last line is a second check that only runs when make has passed. Either way, what turns a failing test into a red step is a command that exits non-zero. You’ll need the same idea in Lab 05, where a script has to tell git whether a commit passed.
Composite actions
The gds job above has two steps, and the second is one line: uses: TinyTapeout/tt-gds-action@ttsky26d. That line runs a composite action, a file called action.yml in the TinyTapeout/tt-gds-action repository whose steps run inside your job as if you’d written them yourself. At the ttsky26d tag it has 18 steps, beginning with “Set up environment variables” and “Install prerequisites”, going through “Fetch verilog and build config”, “Install LibreLane” and “Make GDS with LibreLane”, and ending with “Publish tt_submission artifact”, “Render PNG from GDS” and “Upload gds_render (png) artifact”. In the log, all 18 appear as sections nested inside “Build GDS”, so when “Build GDS” fails, you open it and look for the section that failed inside it.
A tag is only a name for a commit, and its owner can move it. Tiny Tapeout’s own README for the action describes moving a tag that way, with git tag -fa and git push --force, when they update a release. The log records which commit the tag pointed to when your job ran, in a line near the top of each job. This is from a sentry run on Nov 6, 2026, on the tag the current SKY130 templates use:
Download action repository 'TinyTapeout/tt-gds-action@ttsky26d' (SHA:395eedb3eeec3c2f4961c3b04ff2cf87f5525636)If a run that passed last month fails today with no change on your side, compare that hash between the two logs. (The action also fetches Tiny Tapeout’s support tools from their main branch by default, so those can change between runs even when the tag stays where it was.)
Reading a failed run
The path to the cause is always the same: the run, then the job that failed, then the step that failed inside it, then the first error line in that step. GitHub helps with the third part: “Any failed steps are automatically expanded” when you open a job’s log (workflow run logs).
Start with the run’s summary page. Anyone can see it for a public repository, even without signing in. Here’s the gds run that hart-1 made when pull request #5 was merged on Nov 15, 2026 (run 43752267356):
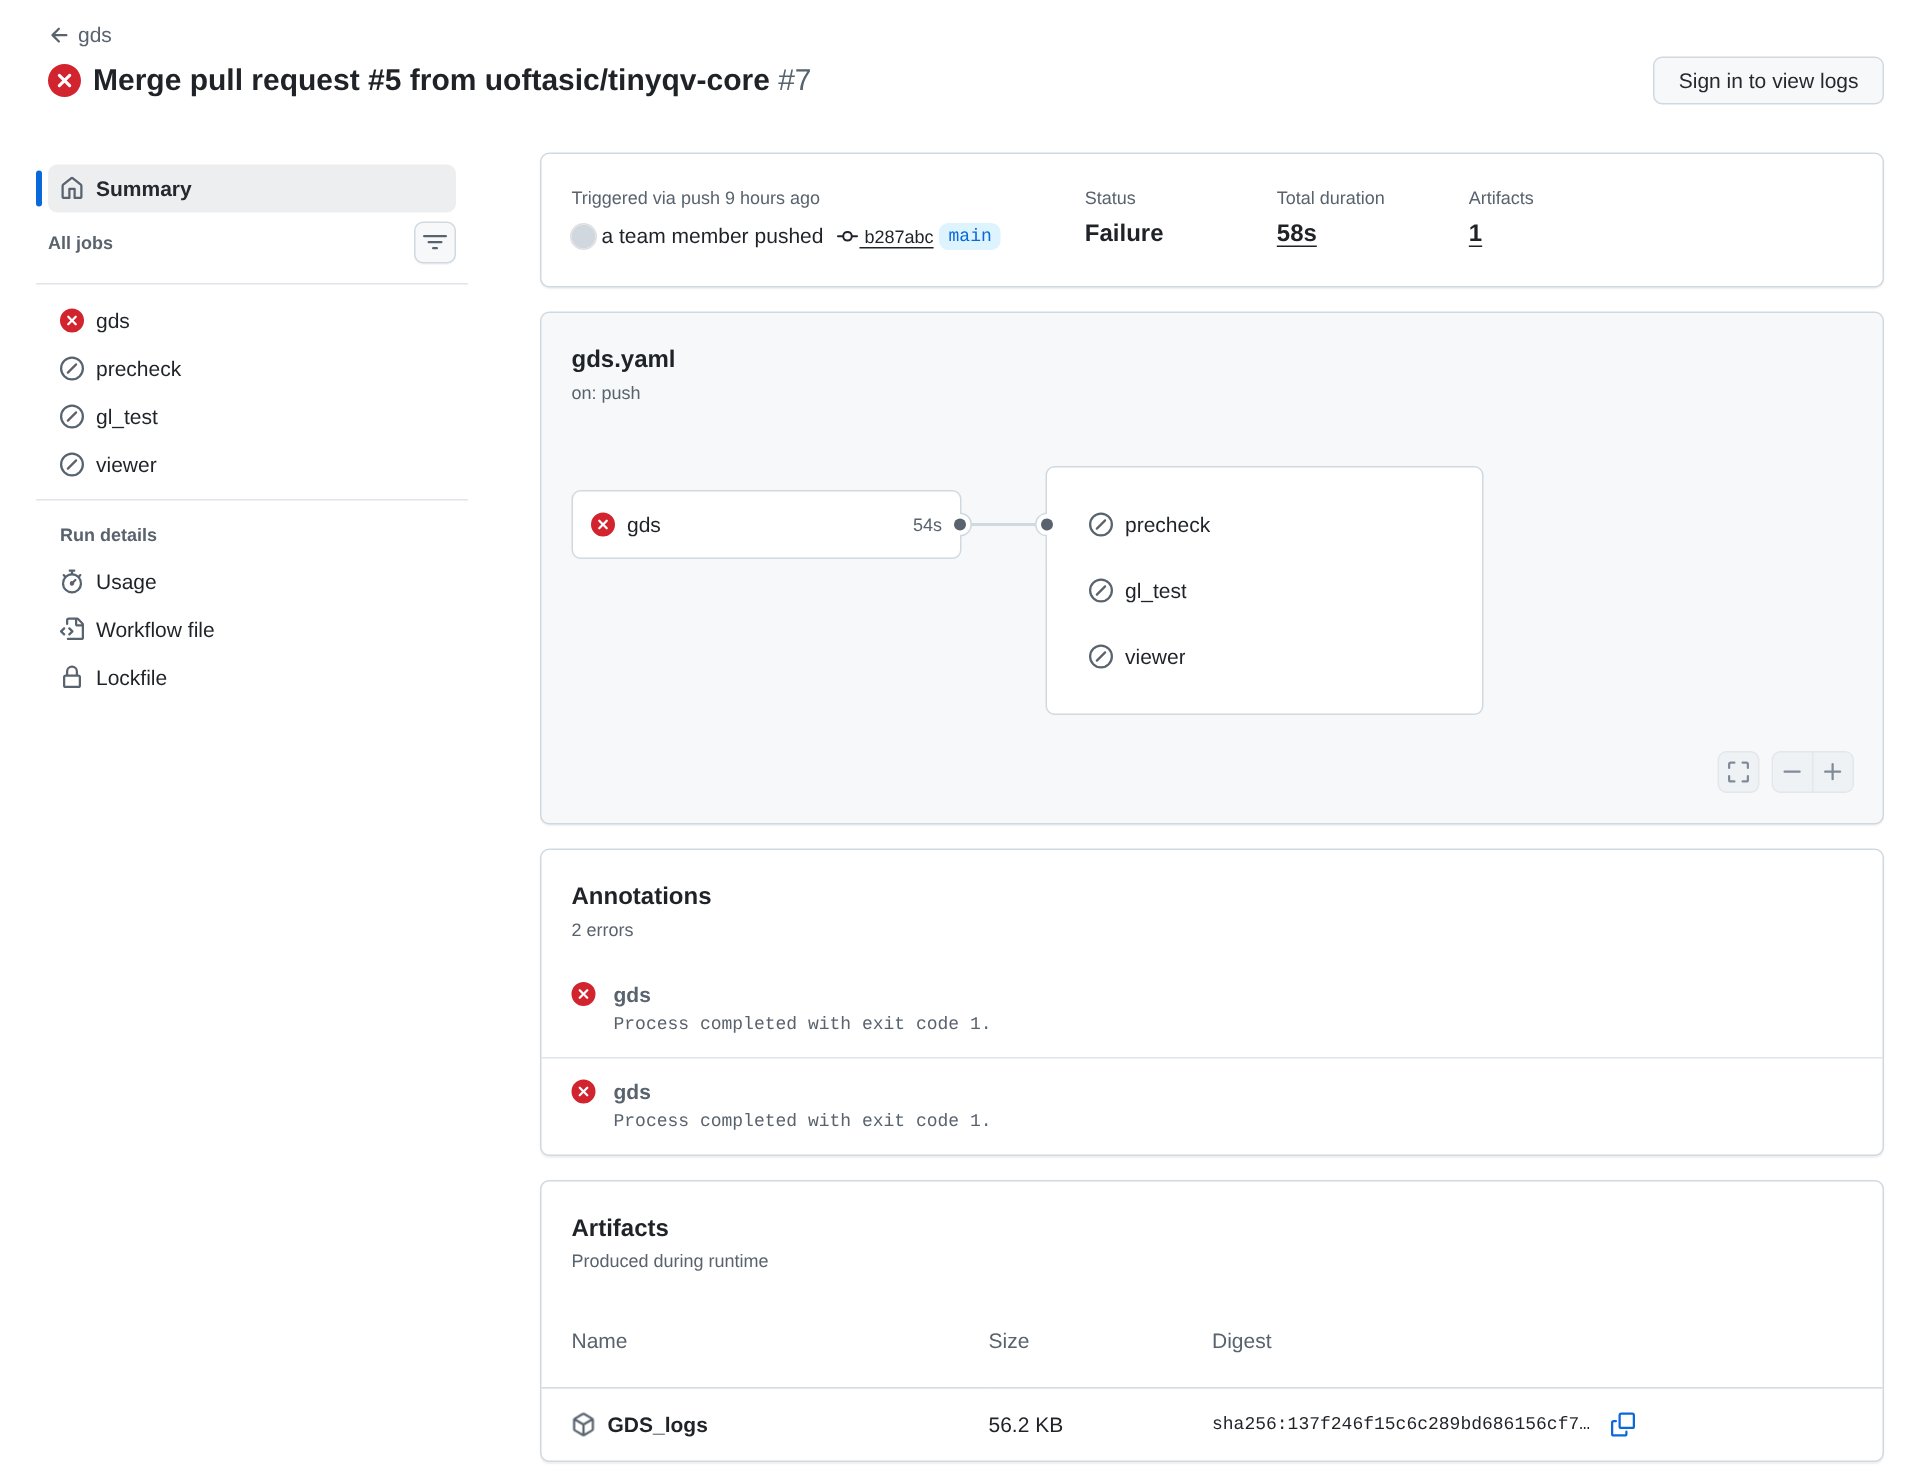
The graph shows that the gds job failed after 54 seconds, which is far too short for a layout build, and that the other three jobs never ran: their grey icons mean “skipped”, because each needs: gds. The annotations box lists the errors GitHub picked out of the log, but here both just say Process completed with exit code 1. They tell you that two steps failed, and not why. For that you need the log itself, which GitHub shows only when you’re signed in.
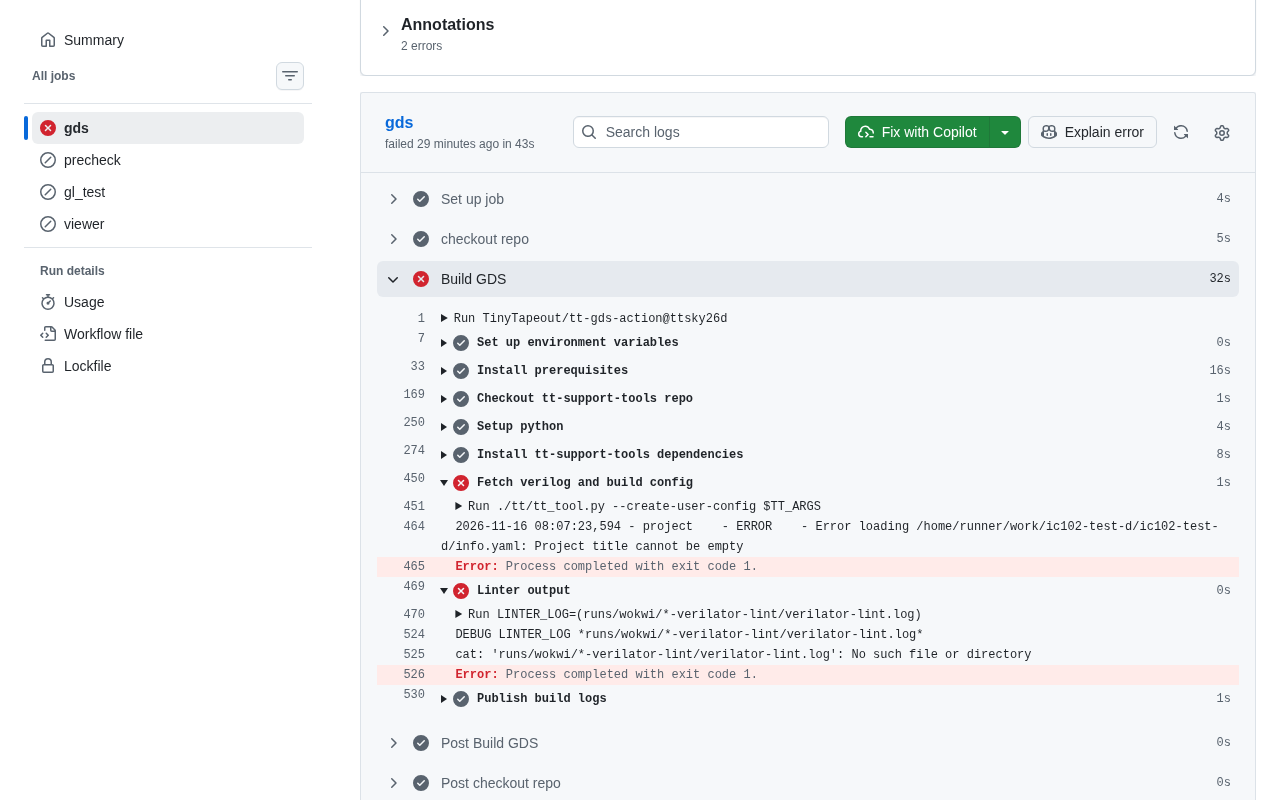
Inside “Build GDS”, the step “Fetch verilog and build config” stops with this, which is the cause:
2026-11-15 19:25:32,583 - project    - ERROR    - Error loading /home/runner/work/hart-1/hart-1/info.yaml: Project title cannot be empty, Project author cannot be empty, Project description cannot be empty
##[error]Process completed with exit code 1.
Most of the steps after it are skipped, but two still run. “Publish build logs” uploads whatever logs exist as the GDS_logs artifact, and before it, “Linter output” prints a second error:
DEBUG LINTER_LOG *runs/wokwi/*-verilator-lint/verilator-lint.log*
cat: 'runs/wokwi/*-verilator-lint/verilator-lint.log': No such file or directory
##[error]Process completed with exit code 1.
That step is marked if: always() in the action, so it runs even after an earlier step has failed, and it fails because the linter it reports on never ran. It’s a consequence, not a second problem, and fixing info.yaml makes both errors go away. That’s the general rule for logs: read from the top, take the first real error as the cause, and be suspicious of anything printed by a step that runs always() or if: failure(), because those steps exist to clean up and report after something else has already gone wrong.
The same pattern shows up in the test workflow. When protocol-emulator renamed its top module in src/project.v but not in test/tb.v (run 40123836544), the “Run tests” step stopped with the cause:
/home/runner/work/protocol-emulator/protocol-emulator/test/tb.v:27: error: Unknown module type: tt_um_example
2 error(s) during elaboration.
*** These modules were missing:
        tt_um_example referenced 1 times.
***
and the two steps that run afterwards regardless each added a message of their own:
##[error]ENOENT: no such file or directory, open 'test/results.xml'##[warning]No files were found with the provided path: test/tb.fst
test/results.xml
test/output/*. No artifacts will be uploaded.Neither of those is a separate problem. The simulation never started, so there was no results file to summarise and no waveform to upload. The fix was one line in test/tb.v.
Job summaries and artifacts
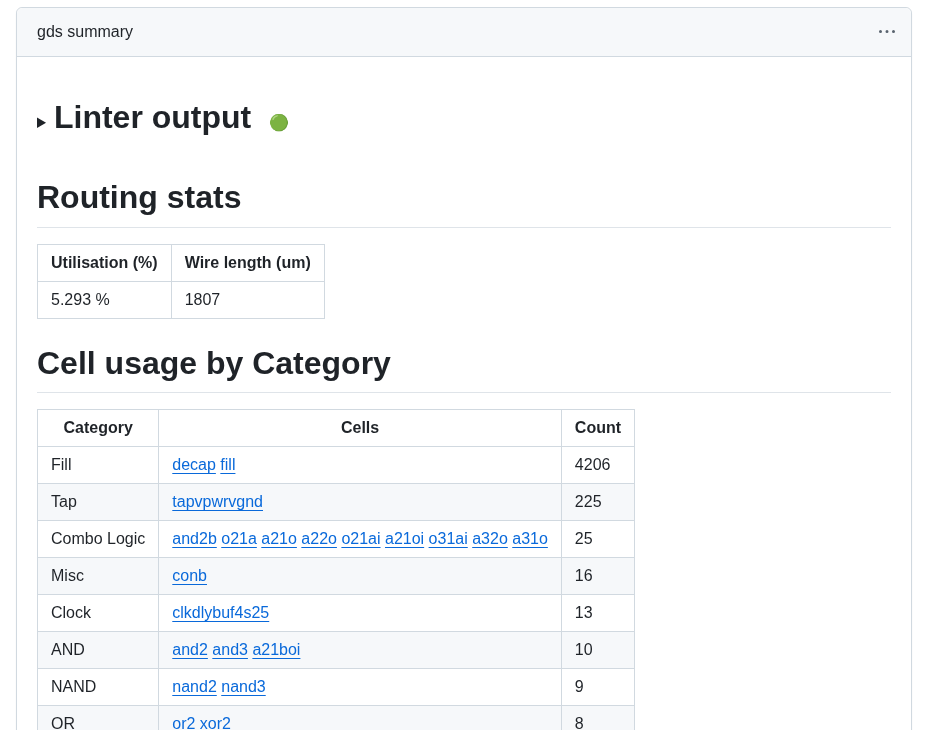
A step can write Markdown to the run’s summary page through a file whose path is in the variable $GITHUB_STEP_SUMMARY, up to 1 MiB per step (workflow commands). The GDS action uses this for its linter output, Yosys warnings, a routing summary and a cell-usage summary, so the numbers you’re most likely to want after a build are on the summary page without opening any logs.
Everything else a job wants to keep, it uploads as an artifact: a zip file attached to the run. Here is a fully green gds run from sentry on Nov 15, 2026 (run 43796948508), with its six artifacts:
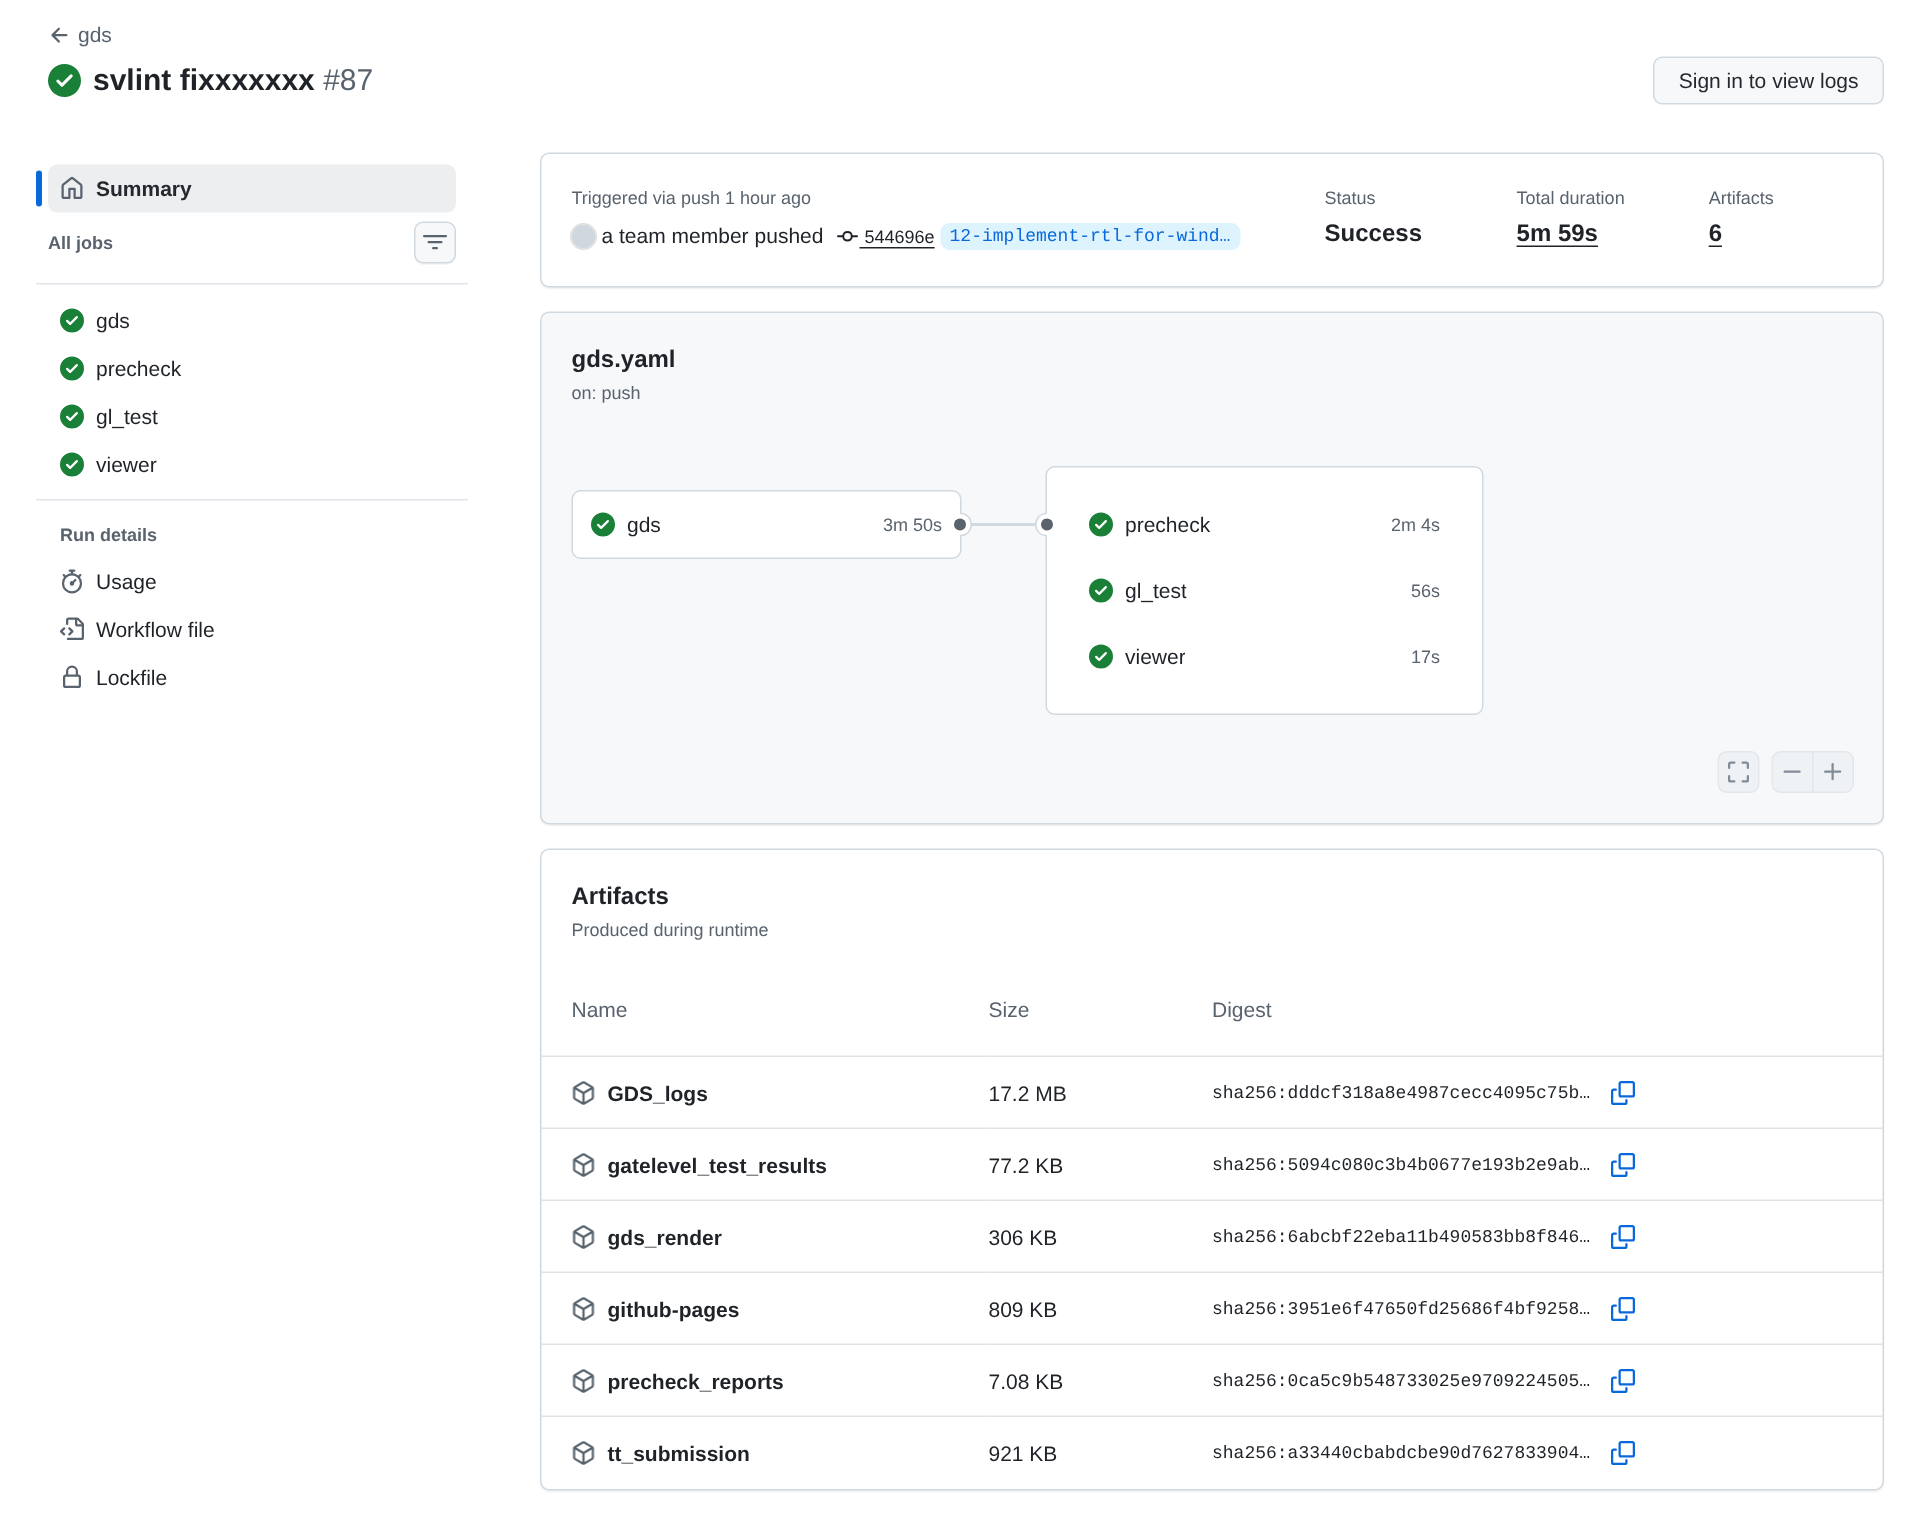
GDS_logs holds your src folder and LibreLane’s whole run folder, which is where the summary numbers come from. tt_submission is what the later jobs download to check and publish. precheck_reports and gatelevel_test_results are the evidence from those two jobs, and gds_render is a PNG picture of the layout. The test workflow uploads one more, test-results, with the waveform and the results file. Artifacts are deleted after 90 days by default, so download the ones you want to keep.
Re-running a run
On a failed run you’ll find a Re-run jobs menu, with a choice between re-running only the failed jobs and re-running all of them. A re-run uses the same commit as the original run (“the same GITHUB_SHA”), and you can re-run “up to 30 days after its initial run” (re-running workflows). So a re-run can’t pick up a fix you’ve committed since; for that you push, or start a new run with the Run workflow button. A re-run is for failures that had nothing to do with your files, such as a fault on GitHub’s side or a repository setting you’ve since changed.
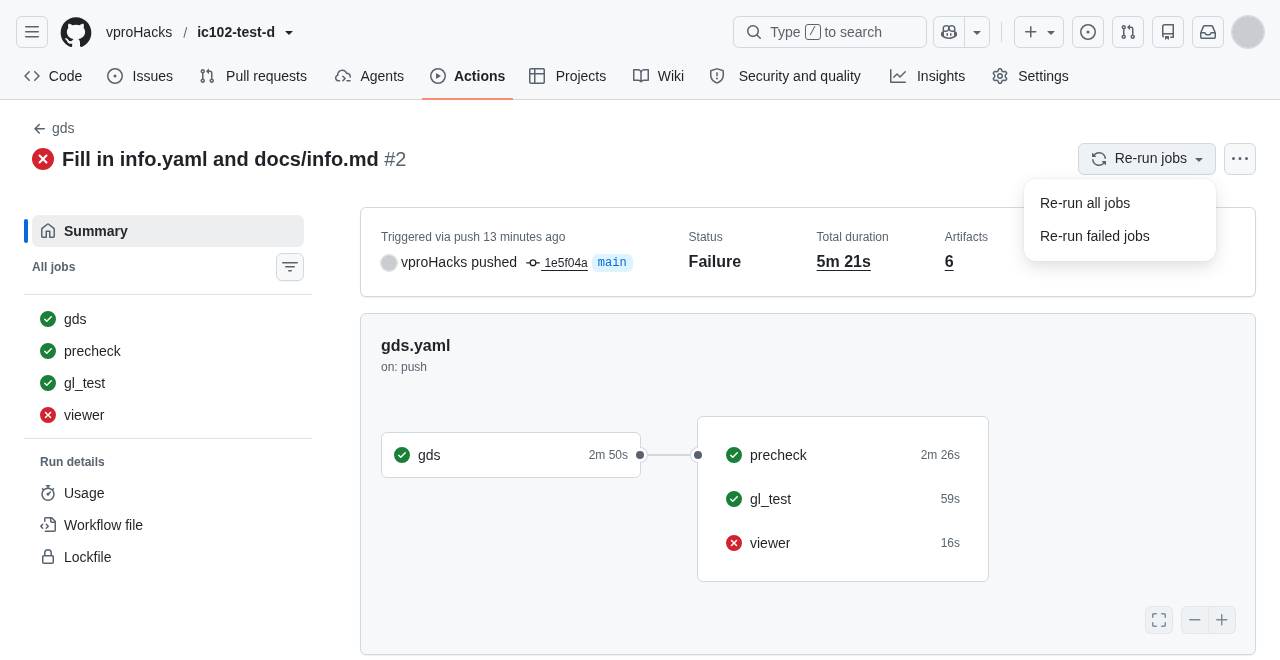
There’s a trap here for the viewer job, and sentry fell into it on Nov 6, 2026 (run 42309512218). The first attempt’s viewer job failed with a fault on GitHub’s side, and the message itself suggested a re-run:
##[error]Error: Failed to create deployment (status: 502) with build version 7d7cb9aff4081ae352fe3bc950122d12792039b6. Request ID 9029:3EA97E:8E9672:1CE8F8A:6AEE5E32 Server error, is githubstatus.com reporting a Pages outage? Please re-run the deployment at a later time.The viewer job was re-run three more times in the next ten minutes, and each attempt failed for a new reason, with a count that went up by one each time:
##[error]Error: Multiple artifacts named "github-pages" were unexpectedly found for this workflow run. Artifact count is 2.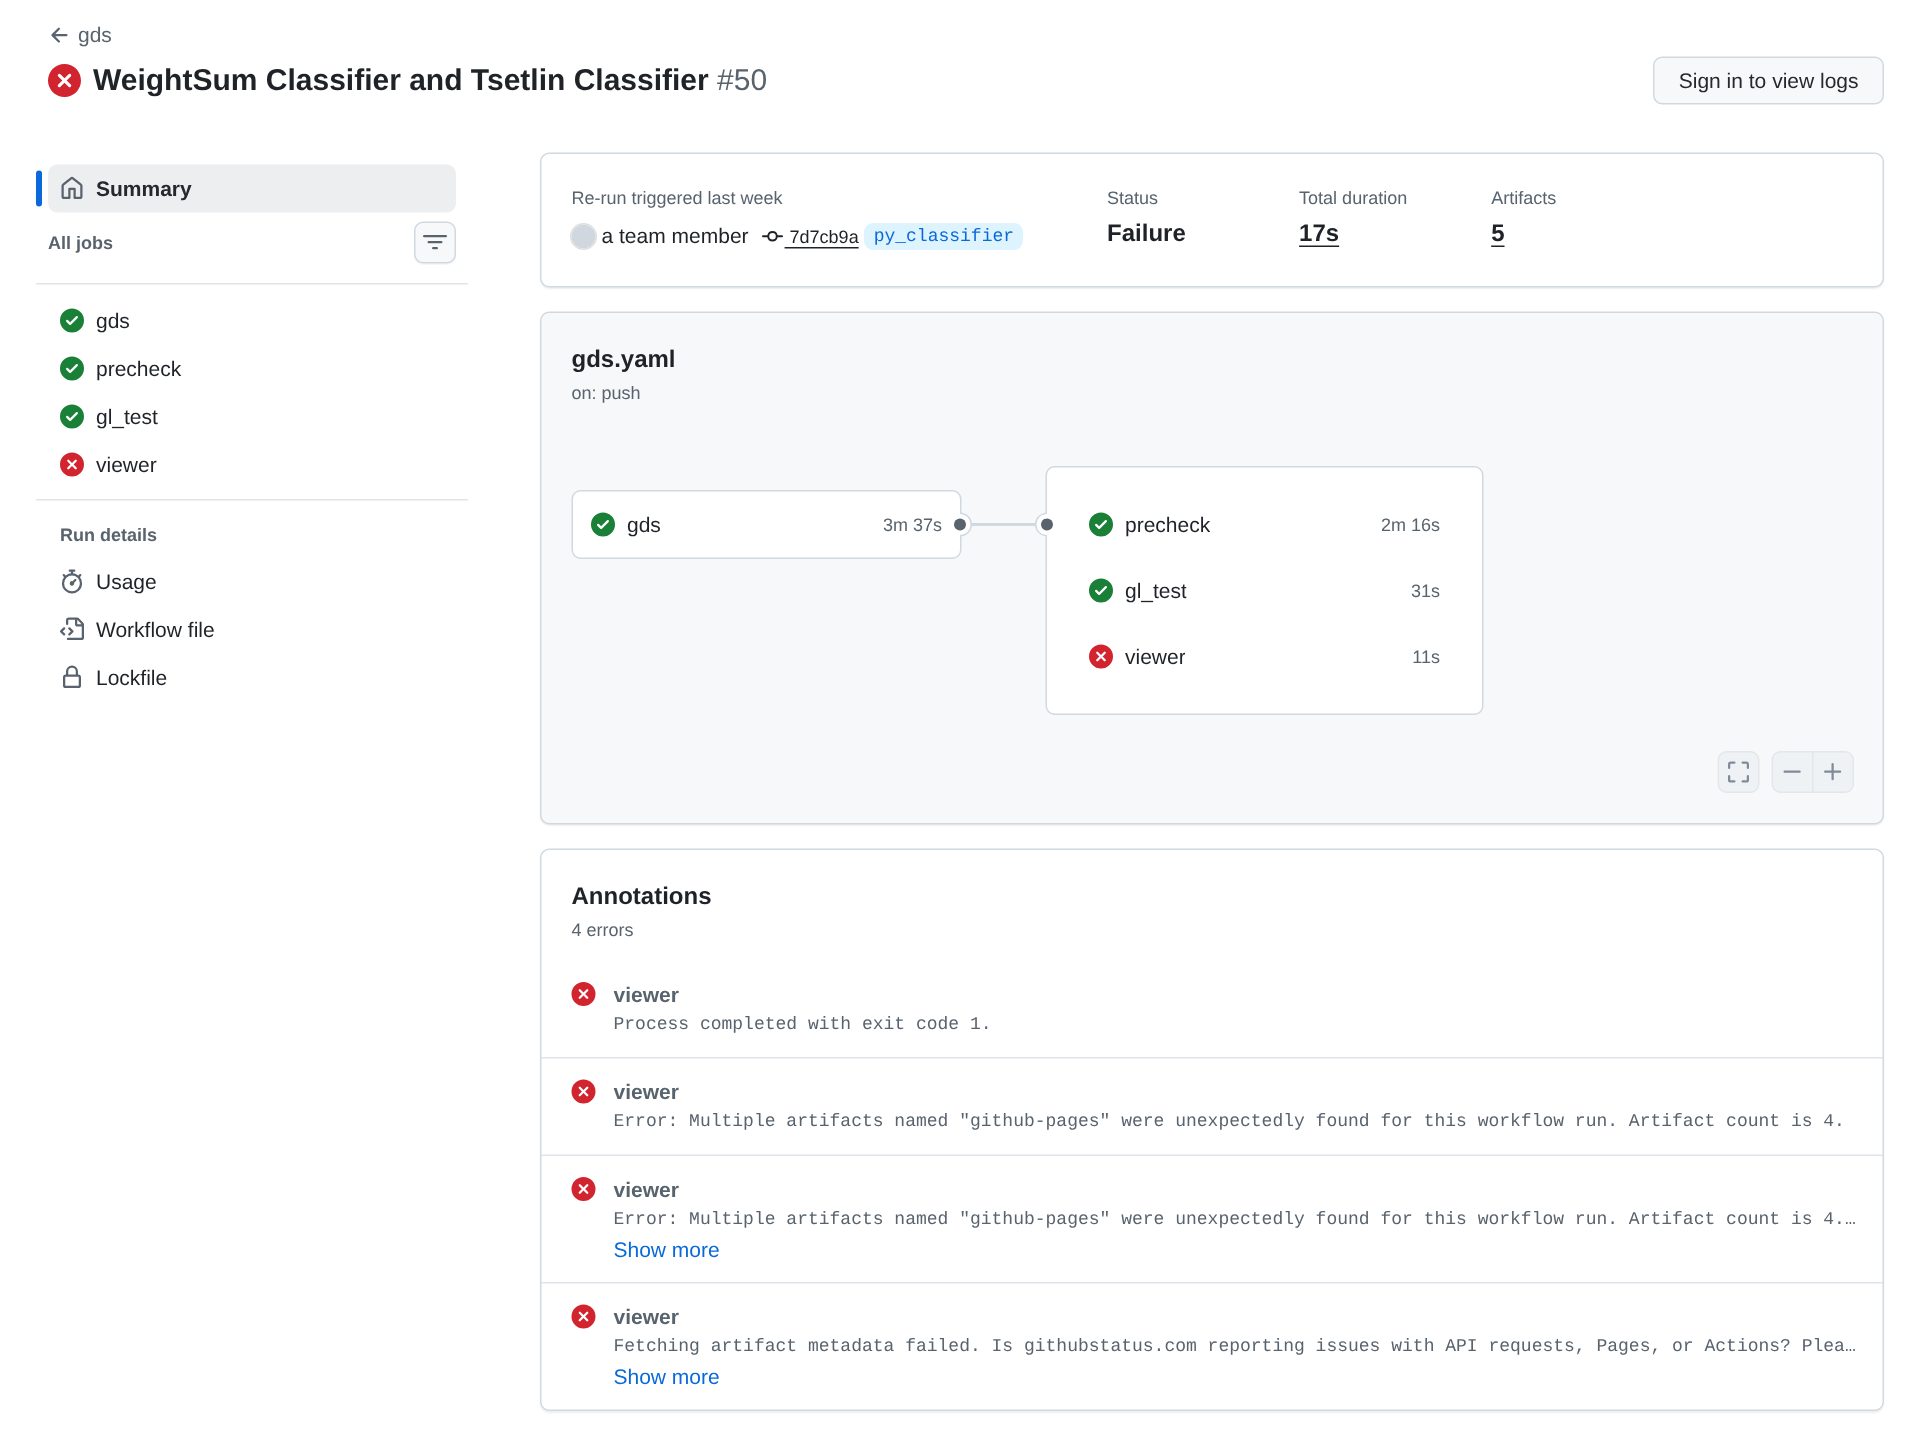
Every attempt uploads a Pages artifact called github-pages, and a re-run keeps the artifacts of the attempts before it, so from the second attempt on there were two or more with the same name, and the deploy step failed instead of picking one. Tiny Tapeout fixed this in their action on Oct 28, 2026 (commit 16c727e, “use a unique pages artifact name per run attempt”). The tags made since then, ttihp27a among them, have the fix, but ttsky26d, the tag in the current SKY130 templates, was made on Sep 18 and doesn’t. The old artifact doesn’t last long, though: the Pages artifact is uploaded with retention-days: 1, so a day later only the new one is left. That’s why protocol-emulator could re-run the viewer job of a two-week-old run on Nov 15 (run 41355878948) and see it pass.
So in a repository on ttsky26d, when the viewer job fails and you’ve fixed the cause, don’t re-run it straight away. Start a new run with Run workflow on the gds workflow (or push a commit), which begins with no old artifacts at all.
GitHub Pages and the viewer
The viewer job downloads tt_submission and gds_render, writes a small web page that opens Tiny Tapeout’s 3D viewer on your layout, and deploys that page with GitHub Pages. For that to work, the repository’s Pages source has to be set to GitHub Actions, under Settings › Pages › Build and deployment › Source (publishing source). A repository made from a template starts with Pages off, as Templates, forks and clones explains, so the first gds run in a new repository can build and check a layout successfully and still end red. That was the state of protocol-emulator’s run on Nov 15, 2026 (run 43757724629):
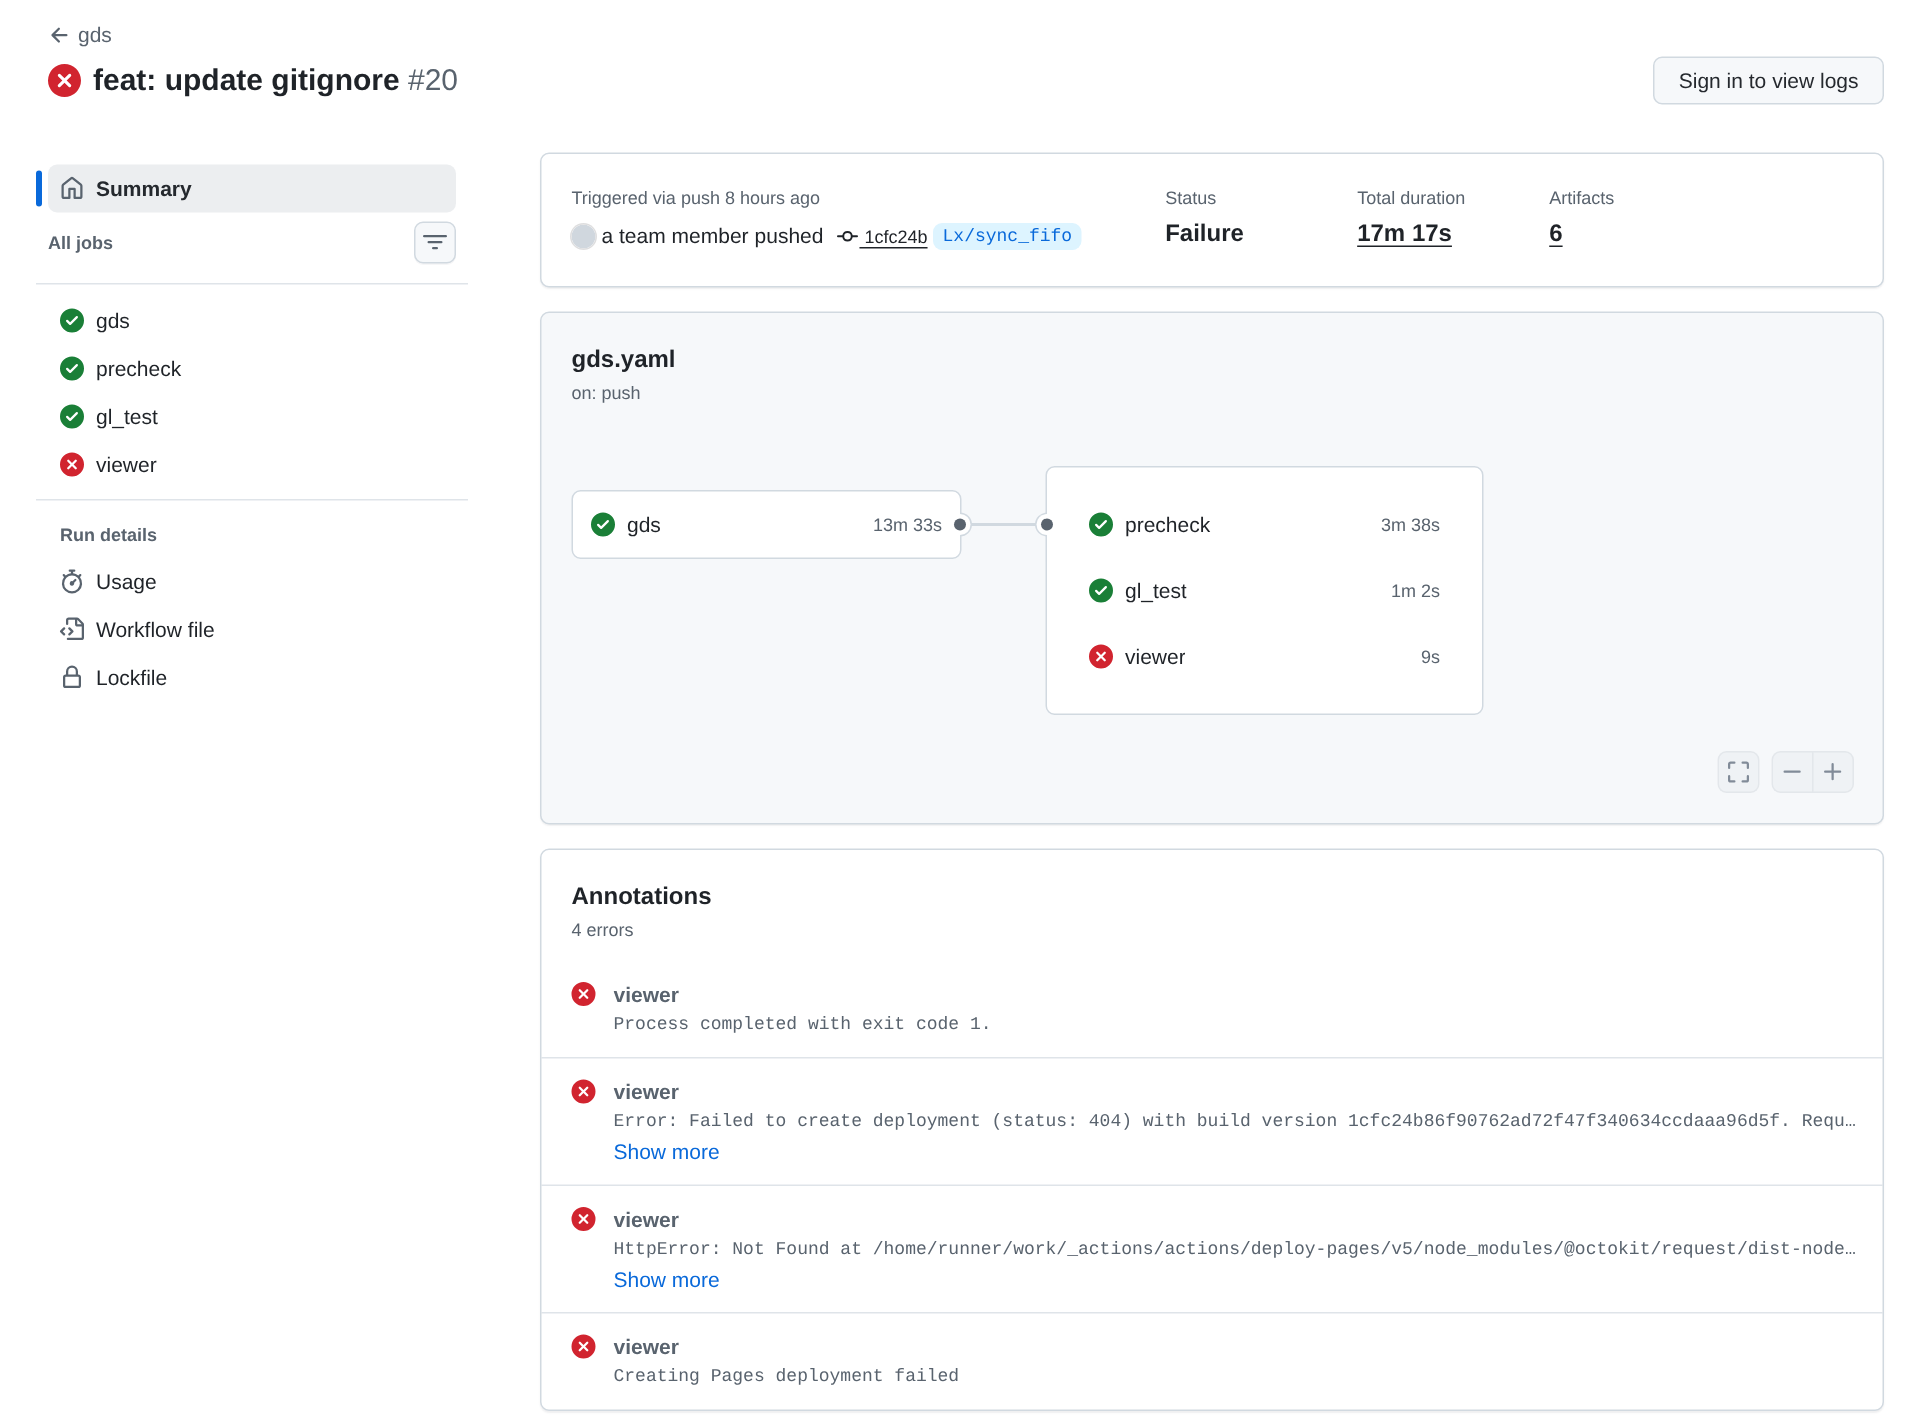
The viewer log says what’s wrong in plain words, at the end of its third error line:
##[error]Creating Pages deployment failed
##[error]HttpError: Not Found
##[error]Error: Failed to create deployment (status: 404) with build version 1cfc24b86f90762ad72f47f340634ccdaaa96d5f. Request ID 5018:223A0C:13B2E1A:3F3E2A0:6AFA17C5 Ensure GitHub Pages has been enabled: https://github.com/uoftasic/protocol-emulator/settings/pagesfollowed by Tiny Tapeout’s own pointer to the fix, from the step that runs on failure:
Failed to deploy to GitHub Pages, please follow the link to troubleshoot: https://tinytapeout.com/faq/#my-github-action-is-failing-on-the-pages-partThat FAQ entry says to change the Pages “Source from Deploy from a branch to GitHub Actions”.
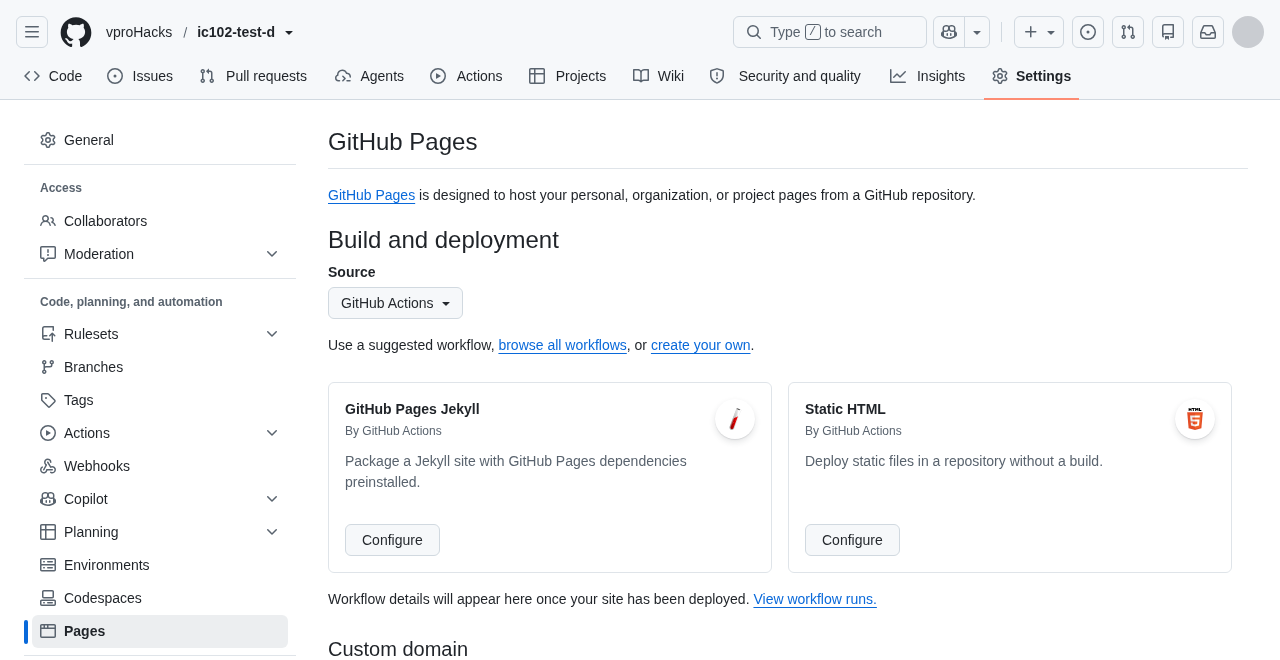
On GitHub’s Free plan, Pages works only in public repositories (custom workflows), which is one more reason the course has you make yours public. In this course a workflow counts as passing only when every one of its jobs is green, viewer included, so turning Pages on, and then starting a new run as the section above explains, is part of getting a repository working. You’ll do it first in Lab 01, and again for every repository you make in this course.
Check yourself
- In the
hart-1run above,precheck,gl_testandviewerhave grey icons. Why didn’t they run, and what line ingds.yamldecides that?
Each of them has needs: gds, which makes a job wait for gds and run only if it succeeded. The gds job failed, so all three were skipped.
- A
gdslog shows aninfo.yamlerror in “Fetch verilog and build config” and then acat: ... No such file or directoryerror in “Linter output”. Which one do you fix?
The info.yaml error, because it comes first and stopped the build. “Linter output” runs with if: always(), so it ran anyway and failed because there was no linter log to show. It goes away once the build runs.
- Your repository uses the
ttsky26dtag. Theviewerjob failed with a 404, and five minutes ago you set the Pages source to GitHub Actions. Do you press “Re-run failed jobs” or start a new run, and why?
Start a new run, with Run workflow on the gds workflow or by pushing. A re-run keeps the first attempt’s github-pages artifact, which lasts a day, and the viewer action at ttsky26d uses the same artifact name every attempt, so the re-run would fail with “Multiple artifacts named”github-pages”“. A new run starts with no artifacts.
- Why does the template’s “Run tests” step run
python -m cocotb_tools.check_results results.xmlaftermake, and does it still need to with the template’s cocotb 2.1.0?
GitHub decides whether a step passed from the exit status of its commands. The line was added for cocotb 1.x, whose make exited with 0 even when a test failed, so reading the results file and exiting non-zero was what turned a failing test into a red step. With cocotb 2.x, make runs the same check itself and exits non-zero, so the step already stops at make. The extra line now runs only after make has passed, and it does no harm.
Next: the page on your template’s workflows, which comes next in this row of the Course path.