The four regions
Your textbook gives you cutoff, triode and saturation. This page draws the boundaries between them on measured curves, shows how to tell which region a device is in, and then adds a fourth region that most textbooks leave out. Each region is one of the channel pictures from How a MOSFET works, seen this time on a graph.
The output curves
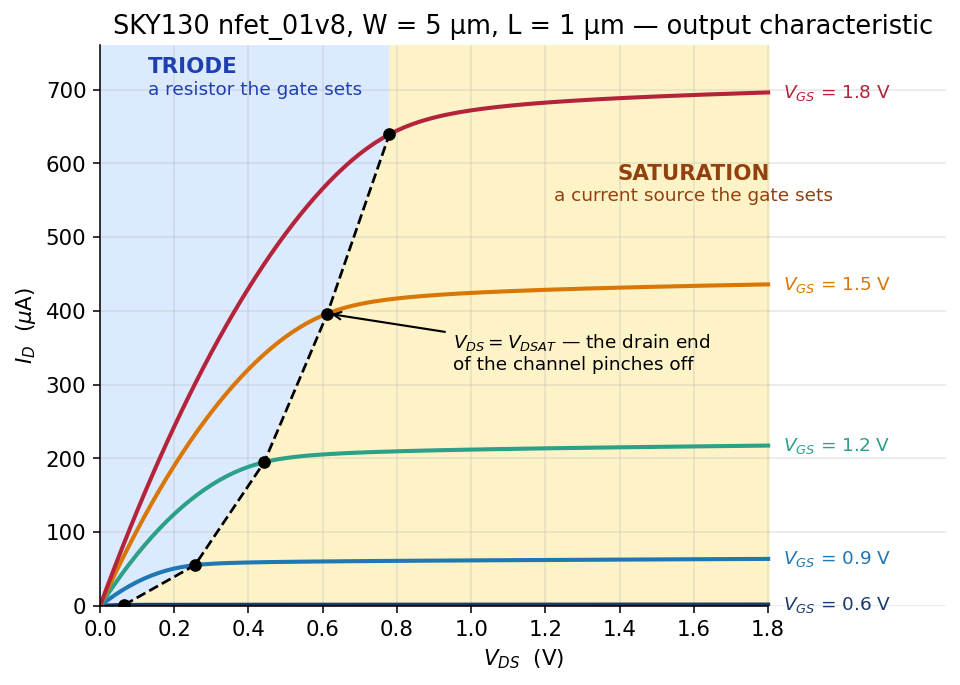
SKY130 nfet_01v8, W = 5 µm, L = 1 µm. Five sweeps of \(V_{DS}\), one per gate voltage, from spice/id_vds.spice in the Lab 03 package, and drawn by src/plot_curves.py. The dashed locus and its dots are the vdsat that the model itself reports at each bias, from spice/op_params.spice, so they show the simulator’s own estimate of where the channel pinched off rather than a fit or a guess of ours.
Almost everything worth knowing about a MOSFET is somewhere in that picture, so we’ll go through it one region at a time and match each region to a panel of the cross-section figure on How a MOSFET works.
1. Cutoff
Condition: \(V_{GS} < V_{TH}\), where \(V_{TH}\) is the threshold voltage.
What the channel is doing: there is no channel yet. The gate hasn’t pulled enough electrons to the surface to form a conducting layer, so the only path between source and drain is two back-to-back diodes, and one of them is reverse-biased.
On the plot: none of the five curves is in cutoff. The lowest one, \(V_{GS} = 0.6\) V, sits right at threshold (the next page measures \(V_{TH}\) = 0.6016 V for this device), and even there the current never gets above 2.005 µA over the whole sweep from 0 to 1.8 V. On a plot scaled for 700 µA that is indistinguishable from the axis, and any gate voltage below threshold gives less current still, so a curve in cutoff would be a flat line along the bottom.
\[I_D \approx 0\]
Keep the “\(\approx\)” in mind, because Section 4 comes back to it.
2. Triode: a resistor the gate sets
Condition: \(V_{GS} > V_{TH}\) and \(V_{DS} < V_{GS} - V_{TH}\).
What the channel is doing: the channel runs all the way from source to drain (panel 2 of the cross-section). It is thinner at the drain end, because the drain’s own voltage partly cancels the gate’s pull there, but it is still continuous, so if you push harder on the drain, more current flows, almost as it would through a wire.
On the plot: triode is the rising left-hand part of every curve, shaded blue. Near the origin the curves are nearly straight lines through zero, which is the signature of a resistor.
\[I_D = \mu_n C_{ox}\frac{W}{L}\left[(V_{GS}-V_{TH})V_{DS} - \frac{V_{DS}^2}{2}\right]\]
You don’t need to memorise that equation, but it’s worth reading. It has a term proportional to \(V_{DS}\) (the resistor), minus a term that grows as \(V_{DS}^2\) (the channel thinning at the drain end). At small \(V_{DS}\) the second term vanishes, and what’s left is Ohm’s law, with a conductance that the gate controls:
\[R_{ch} \approx \frac{1}{\mu_n C_{ox}\frac{W}{L}(V_{GS}-V_{TH})}\]
Lab 03 measures exactly that resistance, by putting 10 mV across the device and dividing by the current that flows:
| \(V_{GS}\) | channel resistance |
|---|---|
| 0.60 V | 26 648.3 Ω |
| 0.90 V | 2 529.2 Ω |
| 1.20 V | 1 288.0 Ω |
| 1.50 V | 907.7 Ω |
| 1.80 V | 736.9 Ω |
How to recognise triode: look at the curve near the origin. If it’s a straight line through zero, the device is in triode and you can treat it as a resistor. The check takes one glance, and it’s right far more often than plugging numbers into the quadratic.
3. Saturation: a current source the gate sets
Condition: \(V_{GS} > V_{TH}\) and \(V_{DS} > V_{GS} - V_{TH}\).
What the channel is doing: the channel has run out of charge at the drain end (panel 3), and the pinch-off point has moved back up the channel (panel 4). Any extra drain voltage falls across the pinched-off stretch rather than across the channel, so the channel keeps carrying the current it was already carrying.
On the plot: saturation is the flat right-hand part of every curve, shaded amber. The height of each flat part is set by \(V_{GS}\) alone, at 2.005, 63.876, 217.505, 436.080 and 696.275 µA for the five gate voltages. Once the device is in saturation the drain voltage has stopped mattering, but the gate voltage still does.
\[I_D = \frac{1}{2}\mu_n C_{ox}\frac{W}{L}(V_{GS}-V_{TH})^2\]
How to recognise saturation: nudge \(V_{DS}\). If \(I_D\) barely moves, the device is in saturation. That is the definition of saturation, and it’s also how bias checks are done in real designs: you perturb the drain and see whether the current changes.
The boundary between triode and saturation
The two conditions above meet where \(V_{DS} = V_{GS} - V_{TH}\). That quantity is called the overdrive voltage, \(V_{ov} = V_{GS} - V_{TH}\), and it’s the number analog designers think in. It’s the drain voltage at which the device stops behaving like a resistor and starts behaving like a current source, so it’s also the headroom the device needs before it will act as one.
Where saturation starts shows where the boundary really sits on these curves, and why at high gate voltage the measured knee is 26 % lower than \(V_{ov}\).
4. Subthreshold: the region most textbooks skip
Now go back to the “\(\approx\)” we asked you to keep in mind in cutoff.
Predict before you read on. The threshold of this device is about 0.6 V. At \(V_{GS} = 0.30\) V, half the threshold and comfortably “off”, how much current flows with 1.8 V on the drain? Write down an order of magnitude. Zero is an acceptable answer, as long as you commit to it.
Now put the same device on a log axis:
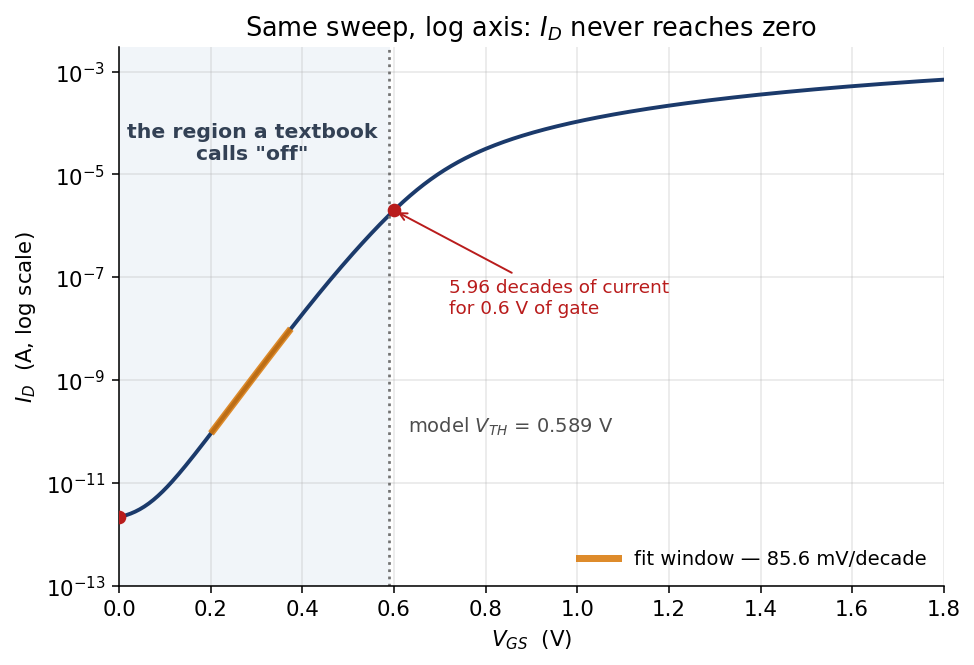
From spice/id_vgs_log.spice. The same device with the drain at 1.8 V, but this time the gate voltage is swept instead of the drain voltage, and the current is on a log axis.
== below threshold   (V_DS = 1.8 V)
   V_GS = 0.00 V   I_D = 2.1853e-12 A
   V_GS = 0.30 V   I_D = 1.3645e-09 A
   V_GS = 0.60 V   I_D = 2.0054e-06 A
   decades from 0.0 V to 0.6 V : 5.96
   subthreshold slope          : 85.6 mV/decade
At 0.30 V the device carries 1.36 nanoamps. That’s small, but it’s a smooth, repeatable, exponential function of gate voltage, so you can’t write it off as zero or as noise. On the linear plot this whole region is a flat line on the axis, but on the log plot it’s a straight line six decades tall, which is what an exponential looks like on a log axis.
This is subthreshold conduction, also called weak inversion. The gate hasn’t formed a proper channel, but it has lowered the barrier enough that some electrons get across by thermal energy, and the number that do is exponential in the barrier height, exactly as in the diode from Lab 02. The physics is the same, so below threshold a MOSFET behaves like a diode.
The slope of that line is the parameter everyone quotes, the subthreshold slope, and on this device it is 85.6 mV per decade: it takes 85.6 mV of gate voltage to change the drain current by a factor of ten. At room temperature no conventional MOSFET can do better than about 60 mV/decade, which is the same \(kT/q \ln 10 = 59.6\) mV you met on the diode page, and real devices land above that limit.
Why leakage matters
Suppose you build a chip with ten million of these transistors and switch it off, with every gate at ground:
\[10^7 \times 2.1853\ \mathrm{pA} = 21.9\ \mu\mathrm{A}\]
That’s tolerable. Now suppose your threshold came out 0.3 V lower than you designed for, which is well within the spread of a real process. In subthreshold the current depends on \(V_{GS} - V_{TH}\) and not on either one alone, so a device with \(V_{TH}\) 0.3 V lower and its gate at ground carries what this device carries with its gate at 0.3 V, which is the 0.30 V row of the output above:
\[10^7 \times 1.3645\ \mathrm{nA} = 13.6\ \mathrm{mA}\]
That’s six hundred times as much current, from a 0.3 V shift in one parameter, on a chip that isn’t doing anything. This is why threshold voltage is controlled so tightly, why “low power” and “high speed” pull in opposite directions (a low \(V_{TH}\) gives you speed and leakage together), and why subthreshold slope has its own line in every process datasheet.
A MOSFET is never fully off. When you hear “the transistor is off”, read it as “the transistor is passing a current I have decided to ignore”, and then ask how many of them there are.
The four regions on one card
| Region | Condition | Channel | \(I_D\) behaves like |
|---|---|---|---|
| Subthreshold | \(V_{GS} < V_{TH}\) | none, but carriers get over the barrier | an exponential in \(V_{GS}\) |
| Cutoff | \(V_{GS} \ll V_{TH}\) | none | zero, for accounting purposes |
| Triode | \(V_{GS} > V_{TH}\), \(V_{DS} < V_{ov}\) | continuous, thinner at the drain | a resistor \(R(V_{GS})\) |
| Saturation | \(V_{GS} > V_{TH}\), \(V_{DS} > V_{ov}\) | pinched off at the drain end | a current source \(I(V_{GS})\) |
Cutoff and subthreshold are the same region seen on two different axes, which is why textbooks merge them. It’s still worth keeping them apart in your head, because cutoff is what you assume when you do digital logic, and subthreshold is what you count when you do a power budget.
You’ll draw these plots and read these numbers yourself in Lab 03, Parts 1, 3 and 4.
Check yourself
- A device has \(V_{GS}\) = 1.2 V, \(V_{TH}\) = 0.6 V and \(V_{DS}\) = 0.3 V. Which region is it in? What if \(V_{DS}\) = 1.0 V?
- Using the subthreshold slope of 85.6 mV/decade, by roughly what factor does \(I_D\) change when \(V_{GS}\) goes from 0.30 V to 0.39 V?
- Why does a lower threshold voltage make a chip faster and leakier at the same time?
Next: Where saturation starts.