The diode equation
This page explains why a diode’s current is an exponential function of its voltage, and where the “60 millivolts per decade” that everyone quotes comes from.
In short, a diode is a barrier, and the current through it is carriers climbing that barrier. The number of carriers with enough energy to climb a barrier of height \(E\) is proportional to \(e^{-E/kT}\), and that fact isn’t specific to electronics: the same statistics make a chemical reaction go faster when you heat it, and make the atmosphere thinner with altitude. Whenever you put a barrier in front of a thermal population of particles, you get an exponential. The rest of this page turns that idea into numbers you’ll measure in Lab 02.
What a junction is
Take one piece of silicon doped so that it has spare electrons to give away (n-type), and one doped so that it has spare vacancies for electrons (p-type; the vacancies are called holes). When you push them together, two things happen, and they work against each other.
Diffusion. Electrons are plentiful on the n side and scarce on the p side, so they spread across, the way a drop of ink spreads through water, and holes spread the other way. Nothing pushes them; diffusion is just the statistics of many particles moving at random.
The field that builds up. Every electron that leaves the n side leaves behind a positively charged donor atom fixed in the crystal, and arrives on the p side as extra negative charge. So the spreading builds an electric field across the junction, pointing from the n side to the p side, and that field pushes the next electron back. The region where the field lives has been emptied of mobile carriers, so it is called the depletion region.
The junction settles into equilibrium when the two effects cancel, with diffusion pushing carriers across, the field pushing them back, and no net current flowing. The field corresponds to a step in energy, a built-in barrier that an electron has to climb to get from the n side to the p side. Nobody applied this barrier from outside; it formed on its own.
Why the barrier gives an exponential
At any temperature above absolute zero, the carriers don’t all sit at the same energy. They are spread over a range, with the number at energy \(E\) falling off like \(e^{-E/kT}\): many carriers with a little energy, exponentially fewer with a lot. That is the Boltzmann distribution, and it is the most reused fact in device physics.
Now apply a forward voltage \(V\): plus on the p side, minus on the n side. That voltage opposes the built-in field, so it lowers the barrier by \(qV\). The number of carriers that can now get over is multiplied by
\[ e^{qV/kT} \]
and the current goes up by the same factor. Two consequences of this describe the whole device:
- Forward bias is exponential, because you are lowering a barrier that an exponentially distributed population has to climb.
- Reverse bias saturates. A reverse voltage makes the barrier higher, which stops the climbers entirely. A second, much smaller current remains: the few minority carriers that thermal energy knocks loose near the junction, which the field then sweeps across. Those carriers fall down the barrier rather than climbing it, so a taller barrier doesn’t produce more of them. Their supply is set by temperature alone, so this current stays at a tiny constant value, called the saturation current \(I_0\).
Together these give the Shockley diode equation:
\[ I \;=\; I_0\left(e^{\,V/nV_T} - 1\right) \qquad\text{where}\qquad V_T \;=\; \frac{kT}{q} \]
\(V_T\) is the thermal voltage, the voltage whose energy \(qV_T\) equals the characteristic thermal energy \(kT\). At the 27 °C that ngspice simulates at, \(V_T = 25.8649\) mV. The \(-1\) makes the current exactly zero at \(V = 0\), and it is also what produces the reverse saturation floor. The \(n\) is an experimental correction called the ideality factor, which lands between 1 and 2 for real junctions, and you’ll extract it from your own data in Lab 02.
Where 60 mV per decade comes from
Rewrite the forward part in terms of decades of current instead of factors of \(e\). To multiply the current by 10 you need \(e^{V/nV_T} = 10\), so
\[ \Delta V = n V_T \ln 10 \]
With \(n = 1\) and \(V_T = 25.8649\) mV:
\[ \Delta V = 25.8649\ \text{mV} \times 2.302585 = 59.556\ \text{mV} \]
That is the famous 60 mV/decade. It comes from \(kT/q\) times \(\ln 10\), which is to say from thermodynamics and arithmetic, so it doesn’t depend on silicon, on doping or on the process. Nothing you can do to a diode makes it steeper than that at room temperature, and heating it makes it shallower. Real junctions are shallower than this ideal by the factor \(n\).
What the SKY130 diode measures
Lab 02 sweeps a 1 µm² SKY130 diode and reports, for each decade of current, the forward voltage needed to reach it:
  current      forward V     mV since previous decade
     1e-12 A   0.181962 V           -
     1e-11 A   0.264643 V       82.68
     1e-10 A   0.342408 V       77.77
     1e-09 A   0.419503 V       77.09
     1e-08 A   0.496518 V       77.02
     1e-07 A   0.573602 V       77.08
     1e-06 A   0.651480 V       77.88
Each of the four decades from 100 pA to 1 µA costs between 77.02 and 77.88 mV. In other words, the device needs a fixed extra voltage for each factor of ten in current, and that is what “exponential” means when you say it in millivolts. A straight-line fit over 1 nA to 100 nA gives 77.037 mV/decade.
That exchange rate matters for all of analog design. It says that a small voltage change makes a big current change, about a factor of ten for every 77 mV on this diode, and that even a big current change moves the voltage only a little. You’re stuck with that trade, because the rate is fixed by physics. Bias networks, references, and every “why is this circuit so sensitive?” question come back to it.
Reading a log axis
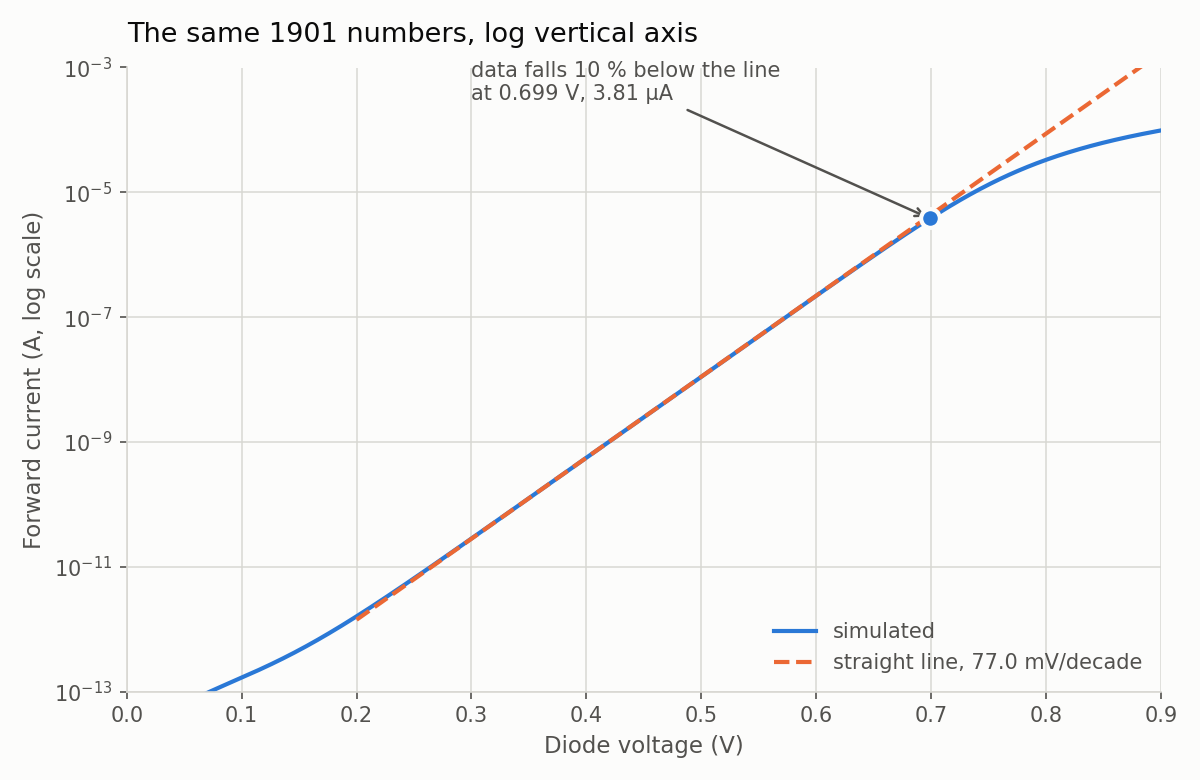
Produced by src/plot_iv.py in the Lab 02 package.
This plot uses the same 1901 rows as the flat-and-a-wall plot in Linearity and superposition; only the vertical axis has changed.
A log axis labels equal distances with equal ratios, not equal differences. The distance from \(10^{-9}\) to \(10^{-8}\) is the same as from \(10^{-8}\) to \(10^{-7}\), even though the second gap is ten times bigger in amps. That has three consequences, and they apply to every analog plot you’ll read:
- A straight line on a log-y plot is an exponential, and only an exponential. Its steepness gives the rate in the exponent, which here is measured in mV per decade.
- There is no zero. Zero is infinitely far down, and a negative number can’t be drawn at all, which is why this plot shows only the forward half. To see both sides of zero you need either two plots or the magnitude of the current.
- Small features at the bottom matter as much as large ones at the top. The wiggle near \(10^{-13}\) spans as much real information as the wall at \(10^{-4}\). A linear axis hides six decades of this device, while this one shows all of them.
To read a value, find the gridline below your point, judge how far up towards the next gridline it sits, and multiply the gridline’s value by the matching factor. Remember that halfway up a decade is ×3.16, not ×5.
The ideality factor
Divide the measured slope by the ideal one:
\[ n \;=\; \frac{\text{measured mV/decade}}{V_T \ln 10} \;=\; \frac{77.0367}{59.556} \;=\; 1.2935 \]
SKY130’s own model card for this diode declares:
+ js = 2.75e-015 ; Units: amper/meter^2
+ jsw = 6e-016 ; Units: amper/meter
+ n = 1.2928
+ rs = 981 ; Units: ohm (ohm/meter^2 if area defined)
The slope gives 1.2935, and the card declares 1.2928, so a foundry parameter pulled out of the slope of a graph agrees with the foundry’s own number to five parts in ten thousand. That is what parameter extraction is, and it is most of what a device engineer does: rather than reading a number off a card, you show that you can get it back out of a measurement. You’ll find the card yourself in Lab 02, Part 4.
Any straight run on a log-current plot gives you an ideality factor. Its slope in mV/decade divided by 59.6 is \(n\), and a value between 1 and 2 tells you you’re looking at a junction. You’ll use the same check on a MOSFET in The four regions, where the line comes out at 85.6 mV/decade. The number lands in the same range for a reason: below threshold, the MOSFET’s current is also carriers getting over a barrier.
Where the straight line ends
The straight part of the log plot runs from about 0.3 V to about 0.7 V. Outside that range it bends at both ends, and the two bends have different causes: the one at the bottom comes from the simulator, and the one at the top comes from the diode.
The bottom of the curve: GMIN
At the bottom left, the curve flattens into a floor near a picoamp. It’s tempting to call that floor the saturation current, but nearly all of it comes from the simulator.
Every SPICE simulator puts a conductance called GMIN across every junction, because a branch that conducts nothing makes the matrix it solves singular and the simulation fails to converge. ngspice’s default is \(10^{-12}\) S, one picoamp per volt.
Lab 02 measures the current at two reverse voltages and one small forward one, with the default GMIN and again with GMIN set a thousand times smaller:
| \(V\) | GMIN = \(10^{-12}\) S | GMIN = \(10^{-15}\) S |
|---|---|---|
| −1.000 V | −1.00356 pA | −4.55885 fA |
| −0.500 V | −0.503558 pA | −4.05763 fA |
| +0.100 V | 0.1672571 pA | 67.35706 fA |
Look at the default column. At −1.000 V the current is 1.00356 pA and at −0.500 V it is 0.503558 pA. The difference is 0.500002 pA across 0.5 V, a conductance of \(1.000\times10^{-12}\) S to six digits. A diode doesn’t have a constant resistance, so this conductance has to come from something other than the diode. It comes from GMIN, which makes up nearly all of the floor.
Subtract GMIN × \(V\) from each reverse reading and what’s left is constant, which is what a saturation current should be:
| \(V\) | current | minus GMIN × \(V\) |
|---|---|---|
| −1.000 V | 1.00356 pA | 3.56 fA |
| −0.500 V | 0.503558 pA | 3.558 fA |
| −1.000 V, GMIN = 1e-15 | 4.55885 fA | 3.559 fA |
| −0.500 V, GMIN = 1e-15 | 4.05763 fA | 3.558 fA |
All four ways give 3.558 fA. Separately, the straight-line fit to the forward curve gives a \(V = 0\) intercept of 3.5864 fA, so two unrelated pieces of arithmetic, done at opposite ends of the plot, agree to 0.8 %. That is \(I_0\), and it’s measured in femtoamps: the entire reverse current of this device is about 22,000 electrons per second.
There’s one more check you can make. With GMIN out of the way, the forward point at +0.100 V reads 67.357 fA. The equation, using only the two numbers extracted from the straight part of the graph, predicts
\[ I_0\left(10^{\,V/77.0367\,\text{mV}} - 1\right) = 3.5864\ \text{fA} \times (19.858 - 1) = 67.63\ \text{fA} \]
That is within 0.4 % of the measurement, and you need the \(-1\) to get there: at 0.1 V the \(-1\) term is still worth 5 % of the answer.
If you report that your diode’s reverse leakage is 1 pA, what you’ve actually reported is ngspice’s default setting. The useful exponential range of a real diode is finite at both ends, and the bottom end may be set by your simulator rather than by your circuit.
The top of the curve: series resistance
Above about 0.7 V the measured curve falls below the straight line and keeps falling further behind. Lab 02 reports the point where it leaves the line: at 0.699 V it carries 3.8136 µA, against 4.2487 µA on the line.
This bend comes from outside the junction, so it doesn’t mean the junction is failing. Its cause is the series resistance of everything the current has to pass through besides the junction: the neutral silicon on either side, the contacts and the metal. You can extract it the same way you extracted \(n\):
  series resistance, from the top of the curve:
    at 0.900 V the diode carries 98.0354 uA
    the straight line needs only 0.804011 V for that current
    so 95.989 mV is dropped outside the junction
    rs = 95.989 mV / 98.0354 uA = 979.1 ohm
The junction itself only needed 0.804011 V, and the other 95.989 mV was dropped getting the current to it. The model card above says rs = 981, so the 979.1 Ω extracted from the shape of the graph agrees with the foundry’s number to 0.2 %.
As the current climbs, the voltage lost to \(I \cdot r_s\) climbs linearly, while the junction’s own requirement climbs only logarithmically, so the resistor term eventually dominates. The local slope shows it taking over (annotations added here):
     V        I(A)         mV/decade
   0.450  2.4887e-09       77.01     <- pure junction
   0.600  2.1945e-07       77.50
   0.700  3.9174e-06       85.92     <- rs starting to cost you
   0.800  3.3105e-05      151.64
   0.850  6.2443e-05      217.80     <- mostly a resistor now
Driving a diode with a current
Everything above says that a diode’s voltage is set by its current, rather than the other way round. Thinking of it that way is the hardest habit to build, because for two years you’ve treated a component as something you put a voltage across.
So you can’t say what voltage a diode sits at until you’ve said what current it carries. If you ask what happens when you put 0.900 V across it, the sweep says it carries 98.0354 µA, which is 25 times the current at 0.700 V for only 200 mV more. There is no such thing as slightly too much voltage on a diode, and that is why every diode in a real circuit has something in series with it to limit the current. If you drive it with a current, it settles at a sensible voltage, but if you drive it with a voltage, you had better have the voltage right.
Check yourself
- Heating a diode from 27 °C to 100 °C raises \(V_T\) in proportion to absolute temperature. Does the ideal mV-per-decade figure go up or down?
- On a log axis, a point sits a quarter of the way from the \(10^{-8}\) gridline to the \(10^{-7}\) one. Roughly what current is it?
- Why does the GMIN floor make the reverse current look larger than \(I_0\), and how did the second GMIN setting confirm that?
- The local slope is 77.01 mV/decade at 0.450 V and 151.64 mV/decade at 0.800 V. Which effect is responsible for the change?
Next: Three diode models.