Lab 02: The diode I–V curve
In this lab you’ll sweep one real SKY130 diode through nine decades of current, show that superposition no longer works once a diode is in the circuit, and pull two of SkyWater’s own model parameters back out of the shape of your graph. Then you’ll work out which parts of the curve come from the diode and which come from the simulator, and heat the diode to 100 °C to see which parameters move.
Package: labs/lab-02-diode-iv/
Before you start
Finish Lab 01:
makeinlabs/lab-01-first-schematicprintsPASSand 501.046 µA.Read Linearity and superposition, The operating point, The diode equation and Three diode models.
Open a terminal in the workbench and go to the lab folder:
cd /foss/designs/modules/ad103/labs/lab-02-diode-ivThis lab doesn’t need any environment setup, so you don’t have to load
.designinit, runmodor setPDK. The decks find the models throughPDK_ROOT, which the image already sets to/foss/pdks, and theMakefilesets it again anyway. You don’t need XSchem in this lab either. If you do open the bench inxschem/, XSchem needsPDK=sky130Ato find its symbols, andxschem/xschemrcsets that for you. (On the image’s default IHP process, this bench netlists toD1 - diode IS MISSING !!!!, and ngspice then simulates it without a single error and writes a column of zeros.)
Time: about 1.75 hours. make takes about 25 seconds, and each of the other targets takes about ten; those wall times depend on your machine. Every other number on this page should come out exactly as printed, because you’re running the same deck on the same image, and the checker enforces them.
The two equations from the guide pages are all the theory you need for this lab:
\[ I \;=\; I_0\left(e^{\,V/nV_T}-1\right), \qquad V_T=\frac{kT}{q}=25.8649\ \text{mV at }27\,^\circ\text{C} \]
\[ \text{one decade of current} \;=\; nV_T\ln 10 \;=\;n \times 59.556\ \text{mV} \]
You’ll measure the left-hand sides and solve for \(n\) and \(I_0\).
Part 1: Run the lab
Does your workbench reproduce the reference sweep?
Look at the bench you’re about to simulate, in the picture below.
makesimulates the hand-written deckspice/diode_iv.spice, andxschem/diode_tb.schis the same circuit drawn as a schematic: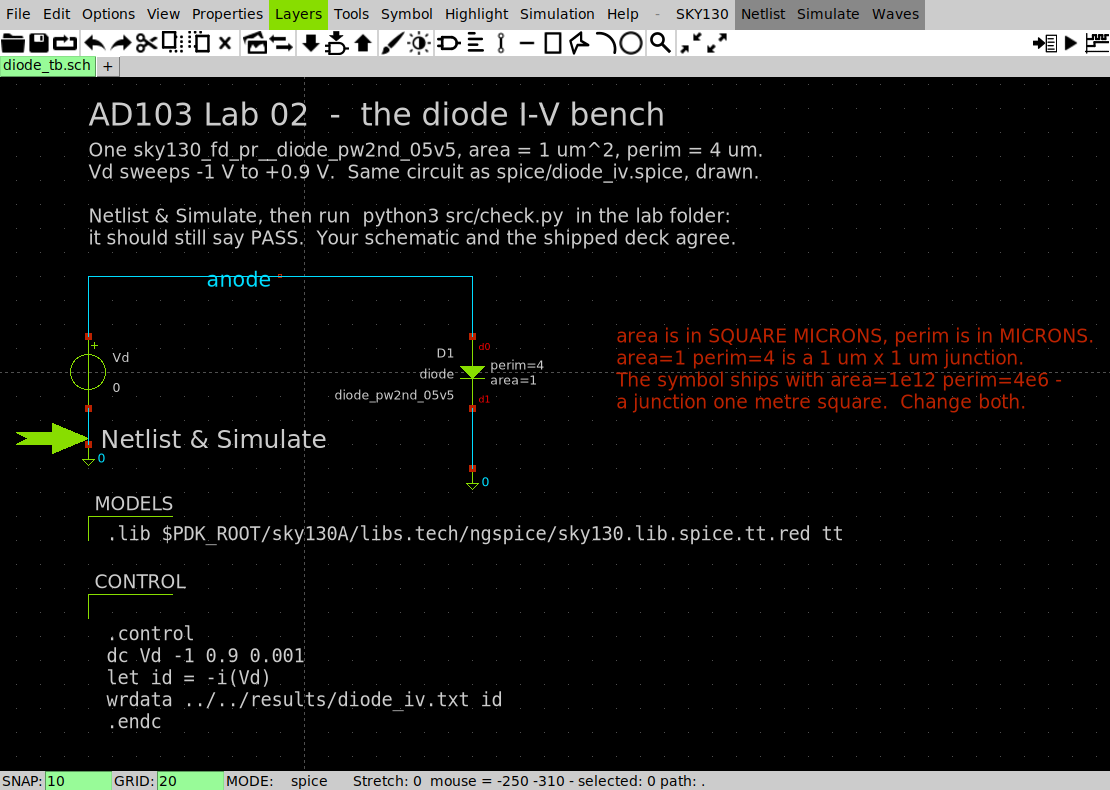
diode_tb.sch in XSchem: one SKY130 diode, one swept source, and the model and control text blocks One
sky130_fd_pr__diode_pw2nd_05v5witharea=1andperim=4, a sourceVdsweeping −1 V to +0.9 V, and the two text blocks that carry the.libline and the.controlblock.Run everything: the DC sweep, the additivity test, three plots, and the checker.
makeIt prints 81 lines, and Parts 2 to 4 go through them one block at a time. The output starts and ends like this:
== DC sweep: 1901 points, -1.000 V to +0.900 V
   (about 10 s, nearly all of it loading the model library)
   wrote results/diode_iv.txt
== additivity test: a resistor and a diode, driven three ways
...
== checking
...
PASS  every number matches the reference run
The checker compares currents to within 1 %, voltages to within 1 mV and the slope to within 0.5 % of the reference run.
You should see PASS every number matches the reference run. Every results/*.log file will also contain IKR too small - model effect disabled!, on every run. That message is harmless, and the ngspice survival card explains why. If something else goes wrong, look in the card’s Error messages table, which lists the diode errors.
Part 2: Test superposition
Does doubling the drive double a diode’s current, the way it does a resistor’s?
The test drives a 100 kΩ resistor and a 1 µm² diode three times each: once with input A (0.35 V), once with input B (0.35 V), and once with A+B (0.70 V).
Predict whether the diode’s
i_d_abwill equali_d_aplusi_d_b. Write down yes or no, and if you say no, which way you think it misses.Print the additivity block on its own:
make line== additivity test: a resistor and a diode, driven three ways --- 100 kohm resistor (amps) --- A alone, B alone, then A+B predicted by superposition, then measured i_r_a = 3.500000e-06 i_r_b = 3.500000e-06 i_r_sum = 7.000000e-06 i_r_ab = 7.000000e-06 --- 1 um^2 diode (amps) --- A alone, B alone, then A+B predicted by superposition, then measured i_d_a = 1.254090e-10 i_d_b = 1.254090e-10 i_d_sum = 2.508180e-10 i_d_ab = 3.917437e-06For the resistor, add
i_r_aandi_r_band compare the sum withi_r_ab. Do the same for the diode.Work out how far off superposition is for the diode, as a factor.
You should see the resistor’s sum match to every digit (7.000000 µA). For the diode, superposition predicts 250.8180 pA and the simulator measures 3.917437 µA, so the prediction is short by a factor of 15,618.6. The checker’s lines near the end of make report the same result: resistor: superposition off by 0.0000 % and diode : superposition off by a factor of 15,618.6.
Part 3: Read the curve on two axes
What does the curve look like on linear and on log axes, and what slope does the log plot have?
Open
results/ad103-diode-iv-linear.png: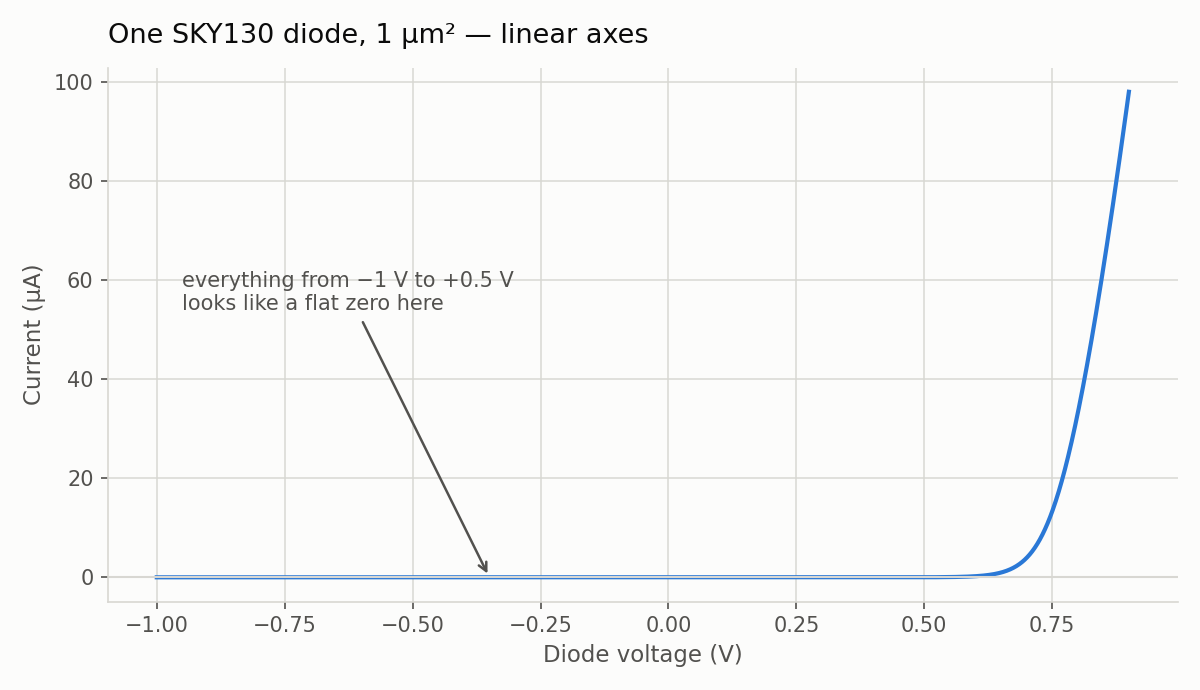
Current against voltage on linear axes: flat, then a wall Try to find the point where the current is 1 nA. Why can’t you?
TipAnswer1 nA is 0.001 % of the top of the axis, far too small to see. The decade table in step 3 says the current reaches 1 nA at 0.419503 V, which on this plot is somewhere in the flat part. Most analog circuits work in the part of the curve that linear axes can’t show.
Open
results/ad103-diode-iv-log.png: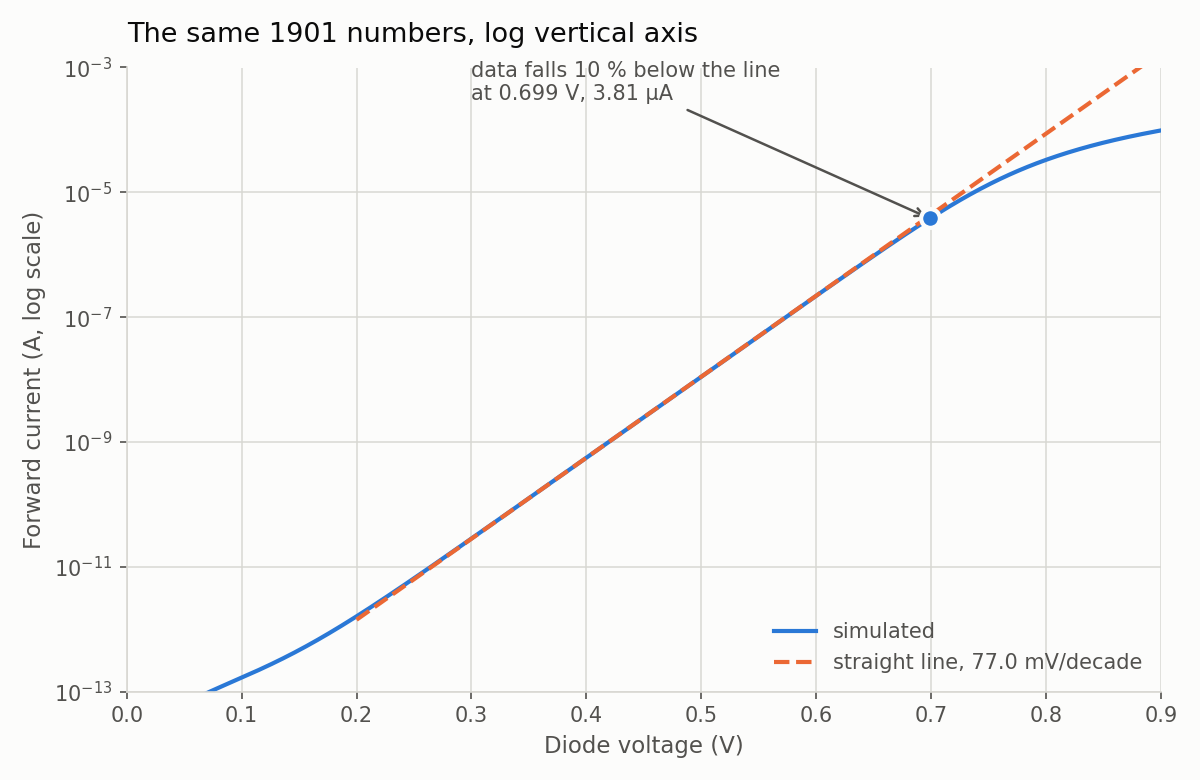
The same data with a log current axis: six decades of straight line Put a ruler on the straight part and read off two points a decade apart. Write down the millivolts between them.
Compare your reading with the decade table in the
makeoutput:current forward V mV since previous decade 1e-12 A 0.181962 V - 1e-11 A 0.264643 V 82.68 1e-10 A 0.342408 V 77.77 1e-09 A 0.419503 V 77.09 1e-08 A 0.496518 V 77.02 1e-07 A 0.573602 V 77.08 1e-06 A 0.651480 V 77.88Then read the
local slope, measured over a 20 mV windowtable further down the output. It gives the slope every 50 mV from 0.050 V to 0.850 V:local slope, measured over a 20 mV window: V I(A) mV/decade 0.050 6.2317e-14 96.11 0.100 1.6726e-13 123.18 0.150 4.6233e-13 101.91 0.200 1.6055e-12 85.75 0.250 6.5318e-12 79.61 0.300 2.8333e-11 77.72 0.350 1.2541e-10 77.19 0.400 5.5825e-10 77.05 0.450 2.4887e-09 77.01 0.500 1.1097e-08 77.02 0.550 4.9442e-08 77.11 0.600 2.1945e-07 77.50 0.650 9.5789e-07 79.19 0.700 3.9174e-06 85.92 0.750 1.3278e-05 107.03 0.800 3.3105e-05 151.64 0.850 6.2443e-05 217.80
You should see a slope of about 77 mV per decade everywhere between about 0.30 V and 0.65 V, and the four middle rows of the decade table agreeing with each other to better than 1 %.
Part 4: Extract \(n\) and \(r_s\), and check the model card
What are the ideality factor and series resistance of this diode, and does SkyWater agree?
Find the fit block in the
makeoutput:fit over 154 points from 1e-09 A to 1e-07 A: slope : 77.037 mV/decade thermal voltage : 25.8649 mV (27 degC) ideality n : 1.2935 I0 (V=0 intercept): 3.5864 fA leaves the line : 0.699 V, 3.8136 uA (line says 4.2487 uA)Divide the slope by the ideal 59.556 mV/decade, \(77.037 / 59.556 = 1.2935\), and you have the ideality factor. The
leaves the linerow shows where the curve starts to bend away from the straight line, at 0.699 V, and The diode equation explains why it bends.Find the series-resistance block and check its arithmetic, which divides the 95.989 mV dropped outside the junction by the 98.0354 µA flowing through it.
  series resistance, from the top of the curve:
    at 0.900 V the diode carries 98.0354 uA
    the straight line needs only 0.804011 V for that current
    so 95.989 mV is dropped outside the junction
    rs = 95.989 mV / 98.0354 uA = 979.1 ohm
Write down your \(n\) and \(r_s\). Then read SkyWater’s own numbers for this diode from its model card:
grep -m1 -A20 'model sky130_fd_pr__diode_pw2nd_05v5 d' \
  /foss/pdks/sky130A/libs.ref/sky130_fd_pr/spice/sky130_fd_pr__diode_pw2nd_05v5.model.spice \
  | grep -E '^\+ (js|jsw|n|rs) '
+ js = 2.75e-015 ; Units: amper/meter^2 + jsw = 6e-016 ; Units: amper/meter + n = 1.2928 + rs = 981 ; Units: ohm (ohm/meter^2 if area defined)
You should see \(n\) = 1.2935 from your fit, against n = 1.2928 on the card, and \(r_s\) = 979.1 Ω, against rs = 981.
Part 5: Find the operating point
Where does a resistor in series with a diode settle, and how close did the hand iteration get?
Solve one resistor and one diode in series, driven from 1.8 V, for three resistor values:
make op== one resistor and one diode in series, three times --- diode voltage at the operating point (volts) --- R = 10 kohm, 100 kohm, 1 Mohm v(n1) = 8.905358e-01 v(n2) = 7.398473e-01 v(n3) = 6.561163e-01 --- and the current through it (amps) --- i_10k = 9.094642e-05 i_100k = 1.060153e-05 i_1meg = 1.143884e-06Compare
v(n2)andi_100kwith the hand iteration on The operating point (0.7335 V and 10.665 µA). How far off was the hand answer: the voltage in mV, and the current in percent?TipAnswerThe hand answer was 6.3 mV and 0.60 % off. The hand iteration assumed a constant 77.04 mV per decade, but above about 0.7 V the curve has already started to bend away from that straight line. The operating point works through the difference.
Open
results/ad103-diode-load-line.pngand check the two marked crossings againstv(n2)andv(n3):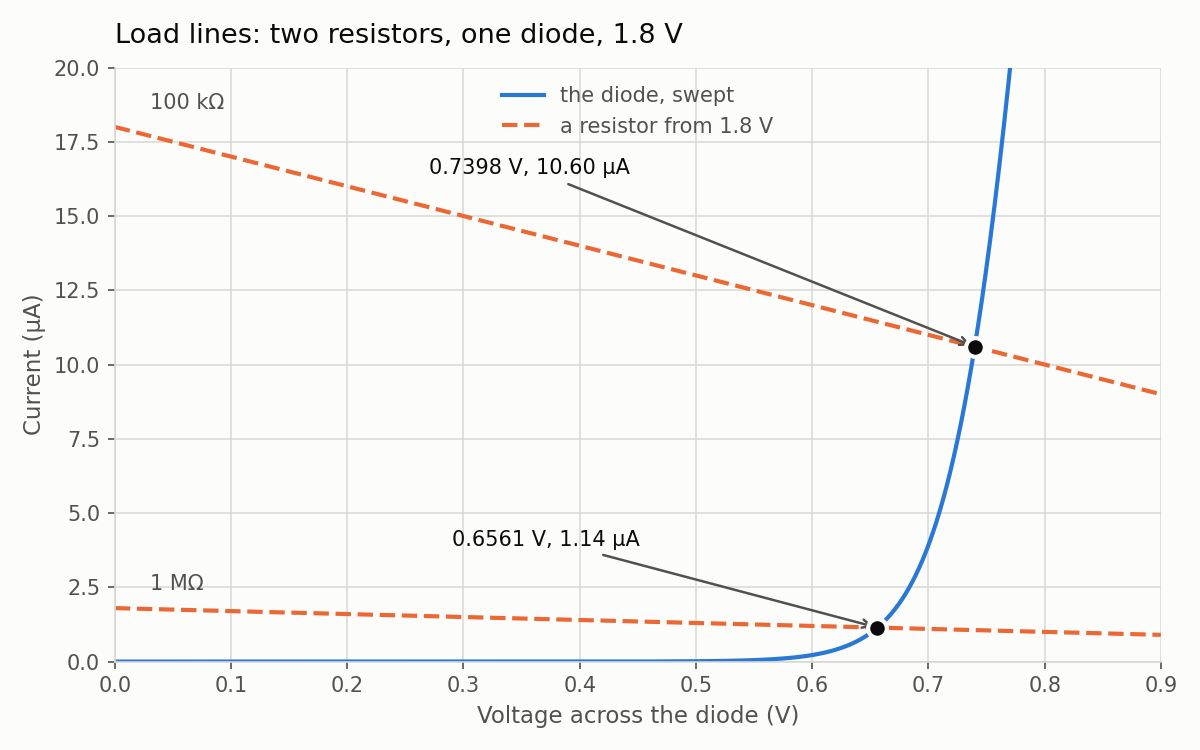
The diode curve with two resistor load lines and their crossings marked Now find the same operating point a completely different way, from the DC sweep, which has no resistor in it at all. This script reads
results/diode_iv.txt, the sweep from Part 1, walks along it until the diode’s current crosses the 100 kΩ load line, and then interpolates between the two points on either side:python3 -c " import sys; sys.path.insert(0,'src') from iv import read_iv v, i = read_iv() prev = None for a, b in zip(v, i): f = b - (1.8 - a)/1e5 if prev and prev[1] < 0 <= f: v0, f0 = prev vx = v0 + (0 - f0)/(f - f0)*(a - v0) print(f'{vx:.6f} V {(1.8 - vx)/1e5:.6e} A'); break prev = (a, f) "0.739846 V 1.060154e-05 A
You should see the plot’s marked crossings at 0.7398 V and 0.6561 V, matching v(n2) and v(n3), and the script’s crossing agreeing with op’s 7.398473e-01 V and 1.060153e-05 A to within one in the sixth digit.
The script’s crossing came from the sweep of a lone diode, while op solved a different circuit, a resistor and a diode together. Why do the two agree so closely?
op solves the resistor and diode once, by iterating, and the sweep is 1901 separate solves of a lone diode with no resistor, so the only thing the two calculations have in common is the device model. Agreement that close means the number comes from the model and not from the way either calculation reached it. That crossing is the bias point, and finding it is the first step in designing any analog circuit.
Part 6: The reverse floor
Is the flat reverse current on the log plot the diode, or the simulator?
Measure the reverse current twice, with two simulator settings:
make floor--- default GMIN = 1e-12 S (amps; negative = current flowing backwards) --- at -1.000 V, at -0.500 V, at +0.100 V i_m1v0 = -1.00356e-12 i_m0v5 = -5.03558e-13 i_p0v1 = 1.672571e-13 --- GMIN = 1e-15 S: the same diode, a thousand times less simulator --- at -1.000 V, at -0.500 V, at +0.100 V j_m1v0 = -4.55885e-15 j_m0v5 = -4.05763e-15 j_p0v1 = 6.735706e-14GMIN is the small conductance that ngspice puts across every junction, and its default is \(10^{-12}\) S. Subtract \(\text{GMIN}\times V\) from each of the four reverse numbers (the
m1v0andm0v5lines). Use \(10^{-12}\) S for thei_lines and \(10^{-15}\) S for thej_lines, and keep the signs, since \(V\) is negative. Write down what’s left.Compare what’s left with the
I0that the forward fit reported in Part 4.
You should see −3.56, −3.558, −3.559 and −3.558 fA (negative because the current flows backwards). That’s the same constant four times, from two voltages and two simulator settings, and it’s close in size to the 3.5864 fA you got from the opposite end of the curve.
Suppose you had reported “this diode leaks 1 pA” from the default run. What would you have been reporting?
You’d have been reporting ngspice’s default GMIN rather than anything about the silicon, because \(10^{-12}\) S across 1 V is 1 pA. The diode equation works through the rest of the arithmetic.
Part 7: Junction area and size mistakes
What does a bigger junction buy, and what happens when the size is written wrong?
Run the area deck:
make area--- Part 1: forward current at 0.500 V vs junction area (amps) --- area = 1, 4, 16, 100 um^2 i_1um = 1.109698e-08 i_4um = 3.457181e-08 i_16um = 1.186544e-07 i_100um = 6.679656e-07Before you calculate anything, predict what
i_100umdivided byi_1umwould be if current were proportional to area. Write it down, then do the division. Then repeat the face-and-edge fit from Three diode models using only the first and last rows, and check that it predicts the middle two. The four junctions are squares, 1×1, 2×2, 4×4 and 10×10 µm, so their perimeters are 4, 8, 16 and 40 µm. That page has the numbers to check your fit against.Read the second half of the same output. (The
Part 1andPart 2in it are the deck’s own section names, not this lab’s parts.) All four of these currents are meant to come from a 1 µm² junction:--- Part 2: three lines that all mean to say 1 um^2, at 0.700 V (amps) --- correct, then perim misspelled as pj, then symbol defaults i_b1um = 3.917437e-06 i_pj = 2.571530e-04 i_def = 2.291258e+06 --- and area=1u, which means a millionth of a square micron (amps) --- i_su = 4.541414e-12ngspice didn’t print an error for any of them. Compare the device lines yourself:
grep -n '^X' spice/diode_area.spiceFor each of the three wrong lines, work out what junction ngspice actually simulated.
TipAnswerWhat you wrote What you got at 0.700 V Why area=1 perim=43.917437 µA correct area=1 pj=4257.1530 µA, 66× too big pjis the raw model card’s name for the perimeter, but the subcircuit parameter is calledperim. Sopj=4is an unknown parameter and is silently ignored, andperimkeeps its default of 1e6, a junction one metre around.(no parameters at all) 2,291,258 A The subcircuit falls back on its own defaults, area=1e12 perim=1e6, which describe a junction one metre square and give you two and a quarter megaamps. An XSchemdiode.symthat you never edit writes the same area, withperim=4e6.area=1u perim=4u4.541414 pA Micron numbers take no unit suffix, exactly as with WandLin Lab 01, so1uis a millionth of a square micron.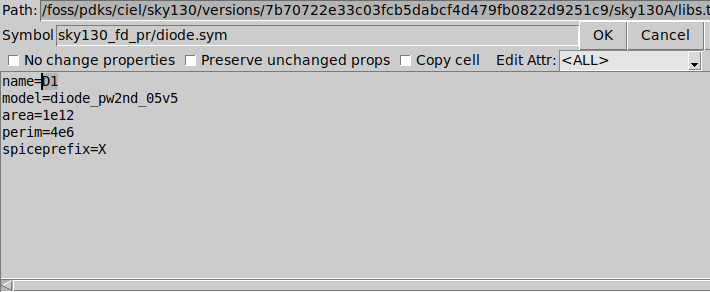
The XSchem property editor on a diode.sym instance, showing model=diode_pw2nd_05v5, area=1e12, perim=4e6 This is the symbol-defaults row as you would meet it in XSchem. A fresh
diode.symcomes witharea=1e12andperim=4e6, shown here in its property editor (q), so whenever you place one, change both before you netlist.
You should see a ratio of 60.19 rather than 100, and four “1 µm²” diodes whose currents range from picoamps to megaamps without a single error message.
In Lab 01 the same u mistake on a MOSFET stopped ngspice with could not find a valid modelname. Why doesn’t it complain here?
MOSFET models are binned, and a device that small falls outside every bin, so ngspice can’t find a model for it. Diode models aren’t binned, so here the same mistake gives you a clean-looking answer that is completely wrong, and nothing but your own checking will catch it.
Check every diode you netlist. Run
grep -n 'diode' <netlist>and read thearea=andperim=on every line. The numbers should be bare microns,perimshould be spelled out, and none of the symbol defaults should be left in place.
Part 8: Read a FAIL you caused
Which checks does a 5 % scaling error trip, and which does it leave alone?
Predict whether the slope check will fail if every current is 5 % too high, and write down your guess.
Hand the checker a sweep that is 5 % off:
make brokensrc/bend_it.pycopies your sweep and multiplies every current by exactly 1.05, a change far too small to see on either plot.== feeding the checker a sweep that is 5 % off, on purpose wrote results/diode_iv_bent.txt (every current multiplied by 1.05) ... FAIL - I(0.450 V) is 2.613143e-09 A, reference is 2.488707e-09 A - off by +5.00 % - I(0.600 V) is 2.304189e-07 A, reference is 2.194466e-07 A - off by +5.00 % - I(0.700 V) is 4.113309e-06 A, reference is 3.917437e-06 A - off by +5.00 % - reverse current -1.0537 pA is not the reference -1.0036 pA - V at 1e-09 A is 0.417871 V, reference is 0.419503 V - V at 1e-08 A is 0.494886 V, reference is 0.496518 V - V at 1e-07 A is 0.571966 V, reference is 0.573602 V - I0 is 3.7644 fA, reference is 3.5864 fA - the whole curve is scaled wrong, which usually means the junction is not the size you think it isNow look at what did not fail. Scroll up to the checker’s lines above
FAILand find theslopeandideality nlines. The checker tests the slope, but it only prints \(n\) as a note and doesn’t test it.Run
makeagain to get back to a cleanPASS.
You should see the slope still at 77.0349 against a reference of 77.0367, and \(n\) still at 1.29348 against 1.29351, while the three decade voltages have each moved by about 1.63 mV.
Why didn’t the slope change, and what does that tell you about reading a wrong curve?
A 5 % scaling error multiplies every point by the same factor, which on a log-current axis moves every point up by the same distance, so the slope doesn’t change; the fit’s last digits move by only 0.002 %. Seen along the voltage axis, the same shift slides the whole line sideways by \(77.04 \times \log_{10}(1.05) = 1.63\) mV, which is exactly the shift in the three decade voltages.
This is the diagnostic habit we want you to take from the lab. On a log-current plot, the slope tells you about \(n\) and the offset tells you about \(I_0\), and the two can go wrong independently. A wrong slope means the physics is wrong. A wrong offset with the right slope means the size is wrong: the wrong area, the wrong perim, or the wrong number of devices in parallel.
Part 9: Heat the diode
What does 100 °C do to the slope, to \(n\) and to \(I_0\)?
Predict the slope at 100 °C. \(V_T\) is proportional to absolute temperature, and 27 °C is 300.15 K while 100 °C is 373.15 K. Write your number down, and say whether you expect \(n\) and \(I_0\) to move as well.
TipAnswerIf only \(V_T\) changes, 77.04 mV/decade becomes \(77.04\times(373.15/300.15) = 95.8\) mV/decade.
Open
spice/diode_iv.spicein a text editor and add this line directly under the.libline:.options temp=100Save the file.
Rerun the sweep and the plots:
make sweep plotsThe
plotsstep prints the fit block, which now reads as follows. It uses 191 points instead of 154, because the sweep steps by 1 mV and the two decades now span 191 mV of it:fit over 191 points from 1e-09 A to 1e-07 A: slope : 95.634 mV/decade thermal voltage : 25.8649 mV (27 degC) ideality n : 1.6058 I0 (V=0 intercept): 8067.1022 fA leaves the line : 0.000 V, 0.0000 uA (line says 0.0000 uA)Ignore the
leaves the linerow for this run. The script reports the first forward point that falls 10 % below the fitted line, skipping points where the line itself is below 1 pA. At 27 °C, where \(I_0\) is only 3.5864 fA, that rule skips the bottom of the curve. At 100 °C \(I_0\) is above 1 pA, so nothing gets skipped, and the script reports the very bottom of the curve instead of the bend near the top that Part 4 looked at.The script still divides by the 27 °C thermal voltage, so its
ideality nline is wrong for this run. Work out \(V_T\) at 373.15 K, and then your own \(n\) from the slope.TipAnswer\(V_T = 25.8649\ \text{mV} \times 373.15/300.15 = 32.156\) mV, so one decade is \(n \times 32.156 \times \ln 10 = n \times 74.04\) mV, and \(n = 95.634/74.04 = 1.2916\). At 27 °C it was 1.2935, so the ideality factor has barely moved.
Compare \(I_0\) with Part 4’s 3.5864 fA. Two things moved the curve: the slope, through \(V_T\), and the intercept \(I_0\). Which moved more?
TipAnswerThe change in slope is all due to \(V_T\), because \(n\) stayed put. \(I_0\) moves far more, from 3.5864 fA to 8067.1 fA, which is about 2,250 times larger. \(I_0\) is carried by the minority carriers that thermal energy knocks loose, and The diode equation explains that their supply is set by temperature alone.
Run the checker on the hot sweep:
make checkIt prints
FAIL, and that’s correct, because you changed the experiment. Read which lines it objects to and which it doesn’t.TipAnswerIt objects to the three forward currents, the reverse current (−9.1362 pA), the three decade voltages, the slope and \(I_0\). It doesn’t object to the two superposition lines, because they come from
spice/straight_line.spice, which still ran at 27 °C. Nor does it object toideality n, which it prints as a note and doesn’t check.Delete the
.options temp=100line and runmake. (Your course folder is the git clone from Lab 01’smod add, sogit checkout -- spice/diode_iv.spicealso puts the deck back.)
You should see a slope of 95.634 mV/decade at 100 °C, within 0.2 % of your prediction, your own \(n\) of 1.2916 and an \(I_0\) of 8067.1022 fA. Once the line is gone, you should see PASS every number matches the reference run again.
Finishing
You’re done when your 100 °C sweep in Part 9 gives 95.634 mV/decade, your own \(n\) from it comes out at 1.2916, and make prints PASS again after you take the line out.
Questions
- What are \(n\) and \(r_s\) for this diode, from your fit, and what does the model card say? (Part 4.)
- Why is the reverse current at −1 V not the saturation current \(I_0\)? (Part 6.)
- Why did a hundred times the area give only 60.19 times the current? (Part 7, step 2: the face-and-edge fit from Three diode models.)
Submit
Nothing to submit.
Going further
None of this is graded.
- Sweep the other diode.
sky130_fd_pr__diode_pd2nw_05v5is the p-diffusion-into-n-well junction, the same idea built the other way up. Change the model name in the deck and see whether \(n\) comes out the same. - Two in series. Put two 1 µm² diodes in series across the sweep source, and predict the decade slope before you run it.
If you get stuck, ask in the team Discord. Quote the exact line you’re stuck on, and say which make target you ran.
Next on the Course path: read How a MOSFET works.